Source: The UConn Poll survey of 1,015 randomly selected adults, Sept. 13 to Sept. 19, 2013.
With enrollment set to begin Oct. 1, a UConn Poll released today finds most Americans disapprove of the landmark legislation formally known as the Affordable Care Act.
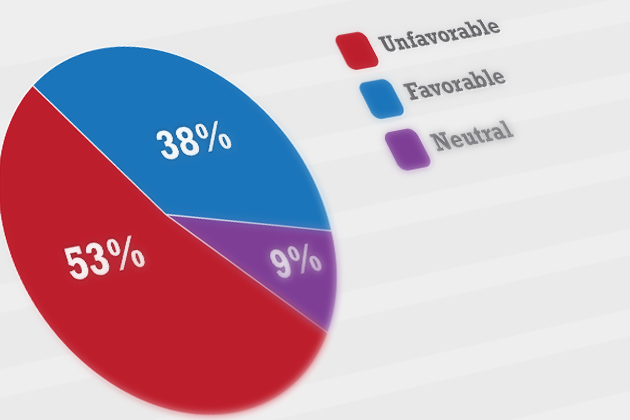
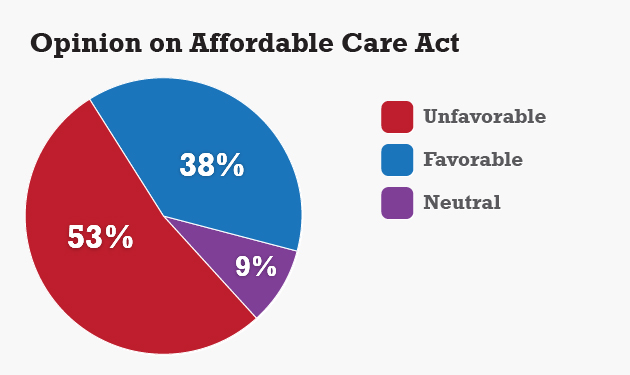
According to the national survey of 1,015 adults, more than half (53 percent) have an unfavorable opinion of the program, with 38 percent having a favorable impression, and 9 percent remaining neutral.
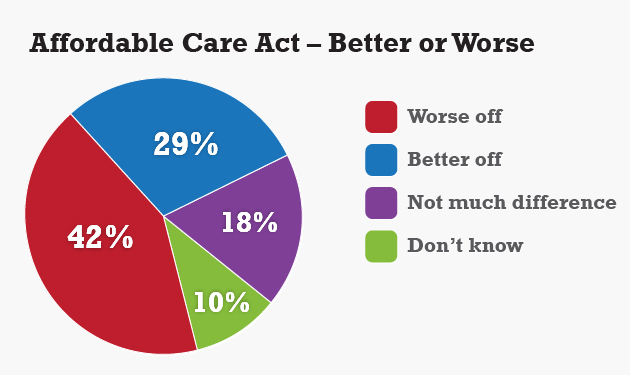
In addition, 42 percent say the country is worse off with the Affordable Care Act, compared to 29 percent who say the country is better for it.
Source: The UConn Poll survey of 1,015 randomly selected adults, Sept. 13 to Sept. 19, 2013.
Starting Oct. 1, people will be able to enroll in online marketplaces set up to help individuals and small businesses buy private health insurance. Nearly all Americans will be required to have health insurance by 2014 or pay an escalating series of penalties to the government.
The UConn Poll found that a large majority of Americans (84 percent) say they’re aware of the deadline to purchase health insurance, one of the Affordable Care Act’s most contentious provisions. Two-thirds (66 percent) say they won’t participate in the health insurance marketplaces opening Oct. 1, including more than a quarter (27 percent) of people who currently have no health insurance.
While most Americans (57 percent) say they have enough information on the Affordable Care Act, significant numbers of respondents are less clear on what the law means. Forty-five percent say they’re not sure how the Oct. 1 opening of insurance marketplaces will affect their own health coverage.
There is broad support for the idea of government-backed healthcare, however, with 61 percent saying the government should provide it for those unable to pay for it, compared to 31 percent opposed.

Source: The UConn Poll survey of 1,015 randomly selected adults, Sept. 13 to Sept. 19, 2013.
“While Americans may like the concept of making healthcare available to all, they aren’t enthusiastic about this particular law,” says UConn Poll director Jennifer Necci Dineen. “Some of that may be tied to how they feel about President Obama and the state of the country.”
According to Paul Herrnson, executive director of the Roper Center for Public Opinion Research and professor of political science at UConn, “Americans’ opinions about the government’s role in providing health care have shifted over time, especially when it comes to addressing the needs of the less well off. In 1938, 78 percent believed that the government should be responsible for providing medical care for those who are unable to pay for it; only 19 percent opposed it. During the early 1990s, public support was at 80 percent.
The poll found that 64 percent of Americans think the country is on the wrong track, with 24 percent saying it’s headed in the right direction. Americans also take a dim view of the job President Obama is doing, with 51 percent disapproving and 44 percent giving him their seal of approval. Congress is even less popular: 77 percent say they disapprove of the job lawmakers are doing, compared to 16 percent who approve.
“Fifty percent of the country is unhappy with the job President Obama is doing, and so that makes it hard to sell a piece of legislation with his name on it,” Dineen says, pointing to low marks for how Obama is handling the federal budget deficit (36 percent approve), healthcare reform in general (44 percent), and the situation in Syria (45 percent).
In a more detailed look at the country’s opinions on the Affordable Care Act, some clear distinctions emerge. Those in the Northeast are more likely to have a favorable view of the law (49 percent) than those in the Midwest (34 percent), the South (35 percent), or the West (37 percent).
Those likeliest to regard the law favorably include Democrats (69 percent), people with a post-graduate education (58 percent, compared to 33 percent of college graduates), and those aged 18 to 34 (52 percent). Those most likely to view the Affordable Care Act unfavorably include Republicans (85 percent), those aged 35 to 49 (66 percent), and people who attended college without earning a degree (62 percent).
Differences in opinion between the two parties are at a historic high. Digging back into the Roper Center’s archive, Herrnson found that 83 percent of individuals who voted for a Democrat in the 1938 congressional elections supported government provision of medical care for the needy, compared to 70 percent of Republican voters. In 1991, 89 percent of Democrats supported this position, as did 73 percent of Republicans and 80 percent of independents. The corresponding figures in the UConn poll are 84 percent, 42 percent, and 60 percent.
For a complete set of questions and tabulations, visit www.poll.uconn.edu.
These findings are based on The UConn Poll. The national sample of 1,015 randomly selected adults were interviewed by landline and cellular telephone between Sept. 13 and Sept. 19, 2013. The margin of sampling error for the survey is +/- 3 percentage points for the entire sample, and larger for subgroups.
The data have been weighted by the number of adults in a household and the number of telephone numbers, land and cellular, at which adults in the household can be reached in order to equalize the chances of an individual adult being selected. The data have also been weighted by the sex, race, and level of education of the respondent, based on the American Community Survey conducted by the U.S. Census.