Some stories are best conveyed with words. Others, with pictures.
A pair of UConn educators recently turned to images to tell the story of the changes in the Connecticut coastline over the past century, showing just how its profile has been tailored by man and Mother Nature throughout that time.

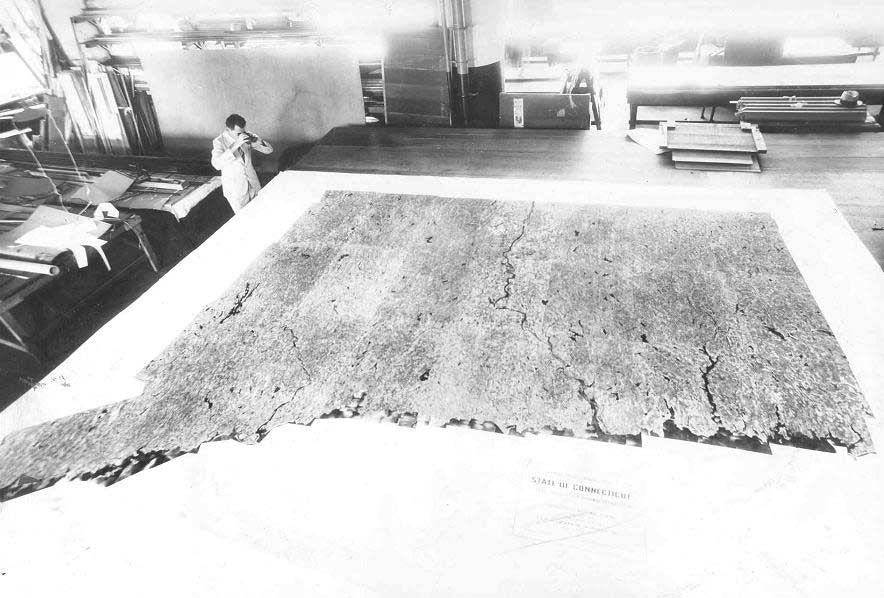
The resulting work, the award-winning Connecticut’s Coast: Then and Now story map incorporates everything from early hand drawings of the coast and aerial photographs from 1934 to present-day drone images, all carefully pieced together to tell the coast’s story.
The changes are a story worth telling to those studying the impact of coastal changes on life and commerce, and to those making policy decisions.
“We try to take this complex information and make it useful for people, and a really great medium to do this is by creating the story map,” says Emily Wilson, an assistant extension educator at UConn whose expertise is geospatial information and maps. “There were many steps, including GIS and imagery analysis, graphics, writing, and design to get from the historic aerial photographs to a completed, polished story map.”
Four years ago, Hurricane Sandy was a wake-up call for many in regard to coastal erosion and the raw force of nature in moving land, so Wilson knew they’d see evidence of changes at that point. But she was surprised to see the coastline had been changing since the early 1930s, the point at which they begin their story.

By looking at images of the same location at different time periods, Wilson found that even in those early years the landscape was being modified by humans. Everywhere there were marshes being dredged or filled and new roads, subdivisions, and construction projects being built, she says.
“Going into this project, I had a preconceived idea humans were not capable of such change with the ‘primitive’ equipment they had available. Now I see we have always had the capability, and already started major changes before 1934,” says Wilson. “We were well on our way to filling every marsh, but self-control through modern zoning and regulations may have slowed us down in time to avoid more serious damage.”
The process of amassing the data for the story map was something that started well before Wilson and her colleague Joel Stocker, also an assistant extension educator, began.
The state scanned the archived historic aerial photographs years ago. More recently, the UConn map library (MAGIC) made these original scans accessible for download. From the MAGIC site, the pair selected images specific to the coast, then matched them to real world coordinates using map tools within ESRI’s ArcGIS software, a cloud-based mapping platform.

An early adopter of drone technology, Stocker used it in the production of the story map. In one case, he flew a remote-controlled plane out over the water at Ocean Beach Park to photograph the same perspective as an aerial shot taken days after the 1938 hurricane. And, as a specific drone project through UConn’s Center for Land Use Education and Research (CLEAR) and Connecticut Sea Grant, he created a high resolution aerial map of Great Gull Island.
Stocker explains the challenge of finding just the right method for conveying this information. “Holding people’s attention is difficult,” he says. “Tools like this, where a user can relate a topic to their own location with an active map, should bring the message home.”
“I’m hoping this map will shed light on how we’ve changed the landscape,” he adds. “Later generations have realized the importance of the resources we were replacing. I like to think they will continue to protect what’s left.”


