The Amazon and the adjacent Andean slopes in South America host an astonishing richness of plants and animals. These species have been sources of food, shelter and medicine since the arrival of humans and a target of scientific curiosity since the days of the earliest European naturalist explorers.
What processes produce such hot spots of species richness, and why does biodiversity gradually decline towards higher latitudes and drier climates? Scientists have proposed many competing explanations, but there is no easy way to test them. As biogeographers, those of us who study the geography of life on the planet, we do not have the option of carrying out real-world experiments. It would be both impractical and unethical to undertake massive introductions or exterminations of species and then wait centuries or millennia for results.
Instead, as reported in our recent study published in the journal Science, we brought together an interdisciplinary team of biogeographers and climate modelers to create a virtual world – a place to do virtual experiments. The world we recreated was a time-lapse simulation of lifeon the continent of South America, from 800,000 years ago up to the present, through the whipsaw climates of the last eight glacial cycles. If patterns of biodiversity produced in this simulated world produced reasonably realistic patterns of diversity, then we could be confident that the ecological and evolutionary processes built into the simulation were right.
What we found was a surprise beyond our fondest expectations. The maps of South American species diversity that emerged from our simulations looked remarkably similar to maps of living birds, mammals and plants. What’s more, the simulations confirmed intermittent migration corridors between the Andes and the Atlantic Rainforest in southeastern Brazil. These regions are currently isolated from each other by drier climates, but scientists have long suspected that connections existed, based on the presence of closely related living species in both regions.
Virtual life in a virtual world
Each simulation began with a single imaginary species, seeded somewhere on a detailed topographic map of South America. In time steps of 500 years, totaling 1,600 steps in all, the climate was updated with a state-of-the-art paleo-climate model created by our colleagues Neil Edwards and Phil Holden at The Open University in the U.K.
In all we ran more than a thousand simulations, each with a different combination of settings for just four variables:
- How long a population must be isolated to become a new species.
- How fast species can evolve to survive, in response to climate change.
- How far a species can move across unsuitable habitat.
- How strongly closely related species compete with each other.
Why was the strong correspondence between our simulated maps of species richness and the real-world maps for birds, mammals and plants so surprising? Because our simulations covered only a tiny slice of time in the long history of South America. Eight hundred thousand years may seem like deep time, but South America separated from Africa 130 million years ago, and the Andes began their rise 25 million years ago. A growing list of South American plant and animal groups are now known to have diversified over the Late Quaternary Period – roughly the past 800,000 years – but most species on the continent are much older.
We also were surprised that our simulated maps resembled actual species richness patterns so closely, because our maps were not guided by any particular target pattern of diversity. They were built strictly on fundamental processes, as understood from basic research in ecology and evolutionary biology. For example, we modeled evolutionary adaptation to climate extremes using principles and equations from population genetics.
From cradle to museum to grave
Species alive today are survivors. They are the upper tips of evolutionary trees with many dead branches below, which represent extinctions in the past. Evolutionary biologists are now able to infer, in many cases, where the ancestors of living species may have lived. Regions where species proliferated in the past have come to be called “cradles” of speciation. For example, the Andean slopes have long been considered a hot spot of speciation.
Regions where species have persisted for especially long periods are called “museums.” Any region, such as the Amazon, where many ancient species persist can be considered a biogeographical museum. In contrast, reckoning where the dead branches in the evolutionary tree should be placed on the map – the “graves” – is virtually impossible by studying the geography of living survivors.
Through our simulations, we followed and mapped the entire “lifetime trajectory” of each virtual species, from cradle to grave, in space and in time.
As the climate changes from step to step in a simulation, the geographical range of a species (its location on the map) may be fragmented by unsuitable climate. If a fragment persists in isolation long enough, it is declared a new species. The time of fragmentation and the location of such a fragment during this period of isolation defines the “cradle segment” of its lifetime trajectory.
When and if a virtual species goes extinct, we record the time and plot on the map the location of the decline towards extinction, which represents the “grave segment” of the species’ lifetime trajectory. The time and place that each species persists between the cradle stage and grave stage defines the “museum segment” of its lifetime trajectory.
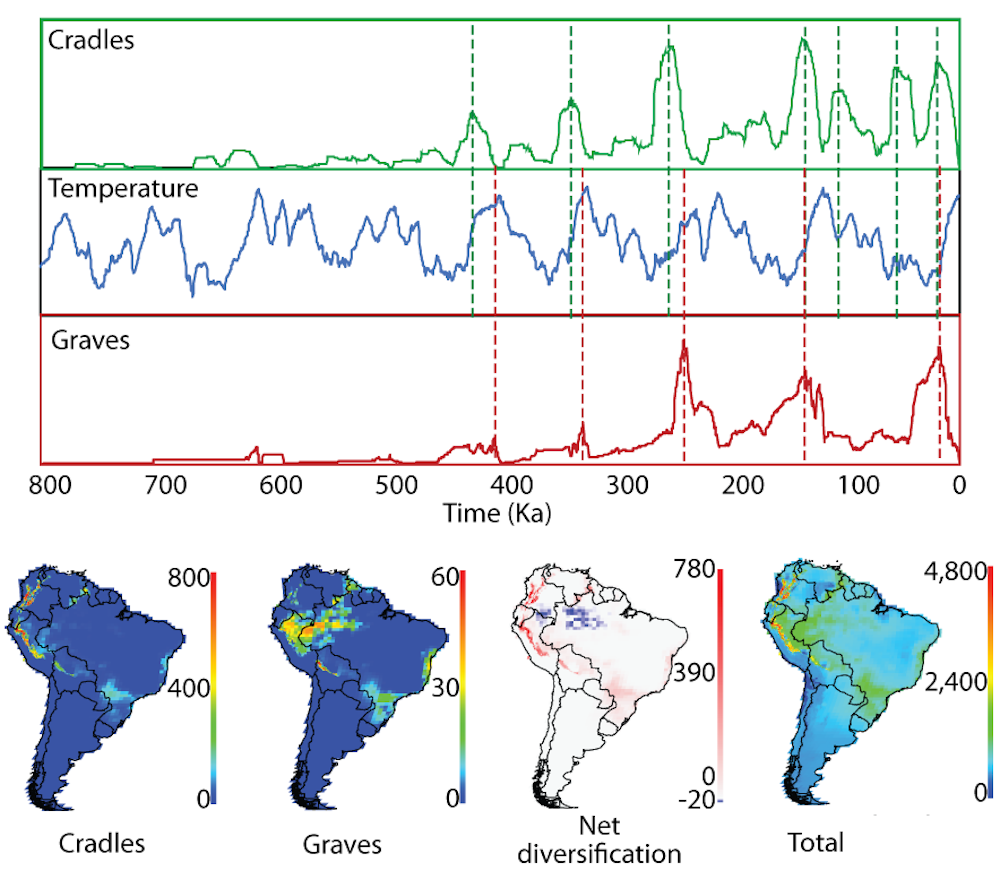
Our simulations produced maps of cradles, museums, and for the first time, graves. The maps confirmed that the eastern slopes of the Andes and the western Amazon are cradles of speciation. Graves of extinction coincided with cradles in some regions, such as the Amazon, and were displaced from cradles in others, such as the Andes. The eastern slope of the tropical Andes proved to be not only a cradle, but also a rich museum of biodiversity.
We also kept track of when speciation and extinction peaked and declined over the course of the simulations, and found that glacial cycles drove both processes. Peaks of extinction tended to follow peaks of speciation in periods of rapid warming at the end of cold glacial periods.
Climate dynamics and topography drive the patterns
Our study leads us to believe that patterns of richness for living species, regardless of a species’ age, have their origins in the same underlying processes that we modeled in the simulation. The interaction between the turbulent climates of the past 800,000 years and the dramatic landscapes of South America drove speciation in some younger groups of plants and animals, but shuffled the location of both young and ancient species in concert, indiscriminately.
Human activities are forcing changes in the global climate at an unprecedented rate, much faster than the climate dynamics in our model. We know that species are already on the move, their ranges shifting at alarming rates on land and in the seas, with profound effects on human life and livelihoods.
Although our simulations were not designed to predict the future, they vividly reveal the dynamic power of climate change to shape life on Earth.
Originally published in The Conversation.