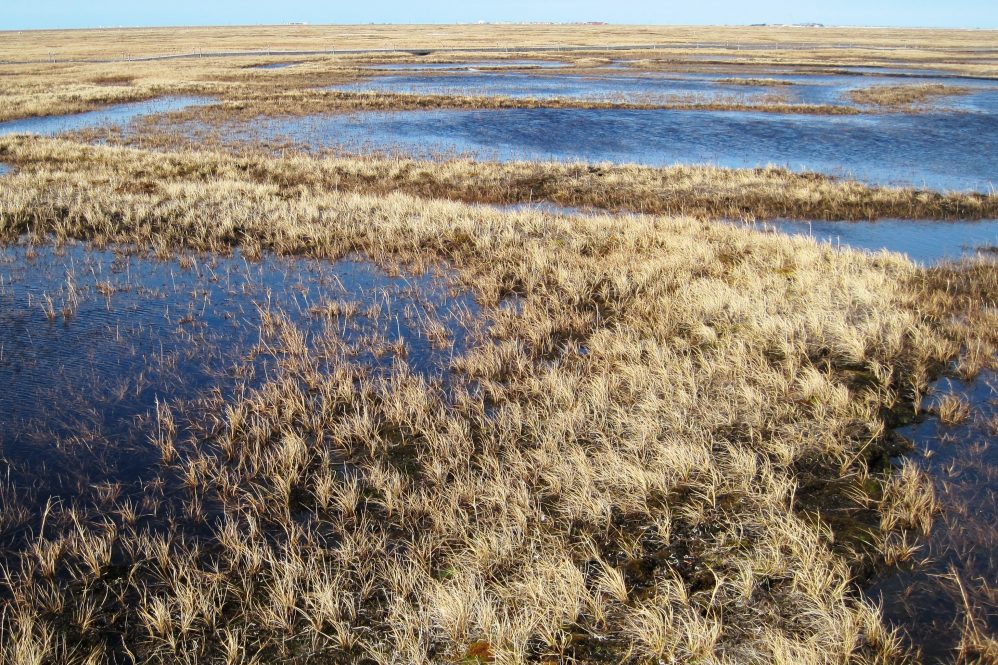
Permafrost — ground that has been permanently frozen for two or more years — makes up a large part of the Earth, around 15% of the Northern Hemisphere.
Permafrost is important for our climate, containing large amounts of biomass stored as methane and carbon dioxide, making tundra soil a carbon sink. However, permafrost’s innate characteristics and changing nature are not broadly understood.
As global warming heats the Earth and causes soil thawing, the permafrost carbon cycle is expected to accelerate and release soil-contained greenhouse gases into the atmosphere, creating a feedback loop that will exacerbate climate change.
Remote sensing is one way of getting a handle on the breadth, dynamics, and changes to permafrost. “It’s like a virtual passport to see this remote and difficult to reach part of the world,” says Chandi Witharana, assistant professor of Natural Resources & the Environment in the College of Agriculture, Health and Natural Resources.
Over the past two decades, much of the Arctic has been mapped with extreme precision by commercial satellites. These maps are a treasure trove of data about this largely underexplored region. But the data is so large and unwieldy, it makes scholarship difficult, Witharana says.
With funding and support from the U.S. National Science Foundation (NSF) as part of the “Navigating the New Arctic” program, Witharana, as well as Kenton McHenry from the National Center for Supercomputing Applications, and Arctic researcher Anna Liljedahl of the Woodwell Climate Research Center, are making data about Arctic permafrost much more accessible.
The team was given free access to archives of over 1 million image scenes taken in the Arctic. That’s a lot of data — so much that traditional analysis and features extraction methods failed. “That’s where we brought in AI-based deep learning methods to process and analyze this large amount of data,” Witharana says.
Shapes of the Arctic
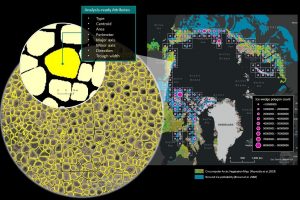
One of the most distinctive, and telling, features of permafrost are ice wedges, which produce recognizable polygons in satellite imagery. The shape and dimensions of ice wedge polygons can provide important information about the status and pace of change in the region. But they short-circuit conventional analysis.
“I was on Facebook some years ago and noted that they were starting to use facial recognition software on photos,” recalled Liljedahl. “I wondered whether this could be applied to ice wedge polygons in the Arctic.”
She contacted Witharana and McHenry, whom she had met at a panel review in Washington, D.C., and invited them to join her project idea. They each offered complimentary skills in domain expertise, code development, and big data management.
The team trained their model with annotated satellite imagery into a neural network and tested it on unclassified data. There were initial challenges, but three years later the team is seeing accuracy rates between 80 and 90%.
They have described the results of this research in the ISPRS Journal of Photogrammetry and Remote Sensing (2020), the Journal of Imaging (2020) and Remote Sensing (2021).
Counting ice wedges with supercomputing
After showing that their deep learning method worked, they turned to the Longhorn supercomputer, operated by the Texas Advanced Computing Center (TACC) — a GPU-based IBM system that can perform AI inference tasks rapidly — as well as the Bridges-2 system at Pittsburgh Supercomputing Center, allocated through the NSF-funded Extreme Science and Engineering Discovery Environment (XSEDE), to analyze the data.
As of the end of 2021, the team had identified and mapped 1.2 billion ice wedge polygons in the satellite data. They estimate they are about halfway through the full dataset.
Each individual image analysis involves pre-processing, processing, and post-processing. In addition to identifying and classifying ice-wedge polygons, the method derives information about the size of the wedge, the size of the troughs, and other features.
Each individual analysis can be performed in less than an hour. But the sheer number makes it unfeasible to run anywhere but on a large supercomputer, where they can be computed in parallel.
This ice wedge data will be available for rapid analysis on the new Permafrost Discovery Gateway, which will “make information about the Arctic more accessible to more people,” Liljedahl says. “Instead of having to wait 10 years to learn about something, they can learn about it right away and explore it directly through their own experience.”
Another important phase of the research project will come when the researchers analyze satellite imagery representing different years and times of year. Comparing the state of the ice-wedge polygons can show trends and trajectories, such as how fast the landscape is changing, and where those changes will cross paths with settlements or infrastructure.
“This is a perfect example of how previous investments in computing infrastructure, combined with new understanding of deep learning techniques, are building a resource to help with an important issue in the Arctic,” says NSF Program Director Kendra McLauchlan.
“Plato said, ‘Man must rise above the Earth — to the top of the atmosphere and beyond — for only thus will he fully understand the world in which he lives,’” Witharana says. “Earth observation technologies enable us to see how climate change is happening and how even the land is changing. It’s the main tool to observe, monitor, predict and make decisions to prevent a negative impact on fragile regions.”
Follow UConn CAHNR on social media