While voters around the country report similar experiences with economic hardships like lost jobs and falling behind on mortgage payments, Democrats and Republicans differ significantly on their satisfaction with their overall well-being, The University of Connecticut/Hartford Courant Poll has found.

Source: The University of Connecticut/Hartford Courant Poll survey of 1,186 likely voters, Sept. 11-Sept. 18, 2012.
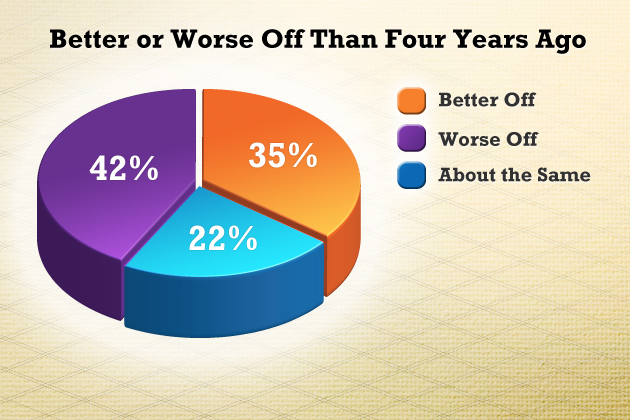
While 42 percent of likely voters say they’re worse off today than four year ago, and 35 percent say they’re better off, those perceptions differ sharply among those who identify with either major political party. While 62 percent of Democrats say they’re better off today, just 9 percent of Republicans feel the same way.
Party identification isn’t the only variable that shows disparities in how voters see their lives right now. The poll found that 78 percent of African-American likely voters say they’re better off today than four years ago, while only 26 percent of white voters said the same. And while 45 percent of likely voters who attend religious services once a week or more say they’re worse off today, just 31 percent of voters who never attend religious services have the same impression.

“I’m going to read you a list of economic problems some people have recently experienced. Please tell me if this has happened to you, personally in the past three years … if this has happened to someone else in your family in the last three years … if this has happened to someone you know well, like a friend, neighbor or co-worker … or if no one you know well has experienced it: Loss of job; reduced wages, hours, or benefits at work; lost health insurance coverage.”
Source: The University of Connecticut/Hartford Courant Poll survey of 1,186 likely voters, Sept. 11-Sept. 18, 2012.
The polling shows that, on some measures of economic well-being, Democrats and Republicans are faring about the same. Eleven percent of both Democrats and Republicans reported losing a job in the past three years, and 6 percent of both groups said they’d fallen behind on mortgage payments or had homes lost to foreclosure.
Other measurements, while not identical, were also close: 13 percent of Democrats reported having an adult child living at home because of dire financial straits, compared to 15 percent of Republicans. Similarly, 10 percent of Democrats said they’d lost health insurance in the last three years compared to 14 percent of Republicans; and 18 percent of Democrats experienced a drop in wages, hours, or benefits at work, compared to 23 percent of Republicans.
“These are fascinating findings, and consistent with the divided nation we have: Although their lives are affected in many of the same ways by the economic downturn, Democrats and Republicans interpret their experience differently,” said Jennifer Necci Dineen, University of Connecticut Poll director. “It is astounding that partisanship could so profoundly and differentially affect how people with very similar struggles view those struggles.”
Forty percent of Republicans also said they lost a significant portion of their savings in the stock market, double the percentage of Democrats who reported the same situation; and about 24 percent of Republicans said they’d had to sell something of value to make ends meet, compared to 13 percent of Democrats.
“There’s definitely a difference in some of the ways people are interpreting the lingering effects of the recession,” Dineen said. “But the biggest divergence doesn’t seem to be in people’s actual circumstances, but in the way they perceive how they’re doing right now.”
Part of that larger picture is that voters are looking to the government for help in jumpstarting the economy. Among all likely voters, 64 percent want Washington to do more to foster job growth, while 29 percent want the market to recover on its own.
“Voters want the government to do more, but they don’t agree on what should be done,” Dineen said. “Twenty three percent of voters want the government to cut taxes on businesses, while the same percentage wants to see taxes raised on some businesses. The bottom line for voters seems to be that Washington isn’t doing enough.”
These findings are based on the University of Connecticut/Hartford Courant Poll. The sample of 1,186 randomly selected likely voters across the country were interviewed by landline and cellular telephone between Sept. 11 and Sept. 18, 2012. The margin of sampling error for the survey is +/- 3 percentage points for the entire sample, and larger for subgroups.
The data have been weighted by the number of adults in a household and the number of telephone numbers, land and cellular, at which adults in the household can be reached, in order to equalize the chances of an individual adult being selected. The data have also been weighted by the sex, race, and level of education of the respondent, based on the American Community Survey conducted by the U.S. Census.
The University of Connecticut/Hartford Courant Poll is a joint effort between one of the nation’s top research universities and the oldest continuously published newspaper in America. The purpose of the poll is to provide unbiased opinion research into critical questions affecting both the state of Connecticut and the nation.
For additional detail from the survey and analysis of the results, go to http://poll.uconn.edu/.


