Science is supposed to be repeatable. But more and more often, scientists are finding it hard to re-do published experiments and get the same results. Now, a large group of neuroscientists suggest software may be part of the trouble.
Science relies on repeated observation to understand the world. Anyone who does the same experiment, observing the same phenomenon, should be able to draw the same conclusions. But lately, fields as diverse as behavioral psychology and cancer biology have had trouble reproducing results from supposedly identical experiments.
Now, a large collaboration of neuroscientists report in the May 20 issue of Nature that they have managed to reproduce the reproducibility crisis in a single experiment. The premise was simple: many different teams of neuroscientists would all analyze the same brain imaging data to answer the same set of questions. In theory, they should all come to the same set of conclusions. But that’s not what happened.
Brain imaging data is an appealing target. Popular descriptions of the technique make it sound as if brain imaging delivers obvious results: the subject thinks about or does something, and a specific part of their brain lights up. But in practice, it requires quite a bit of data analysis.
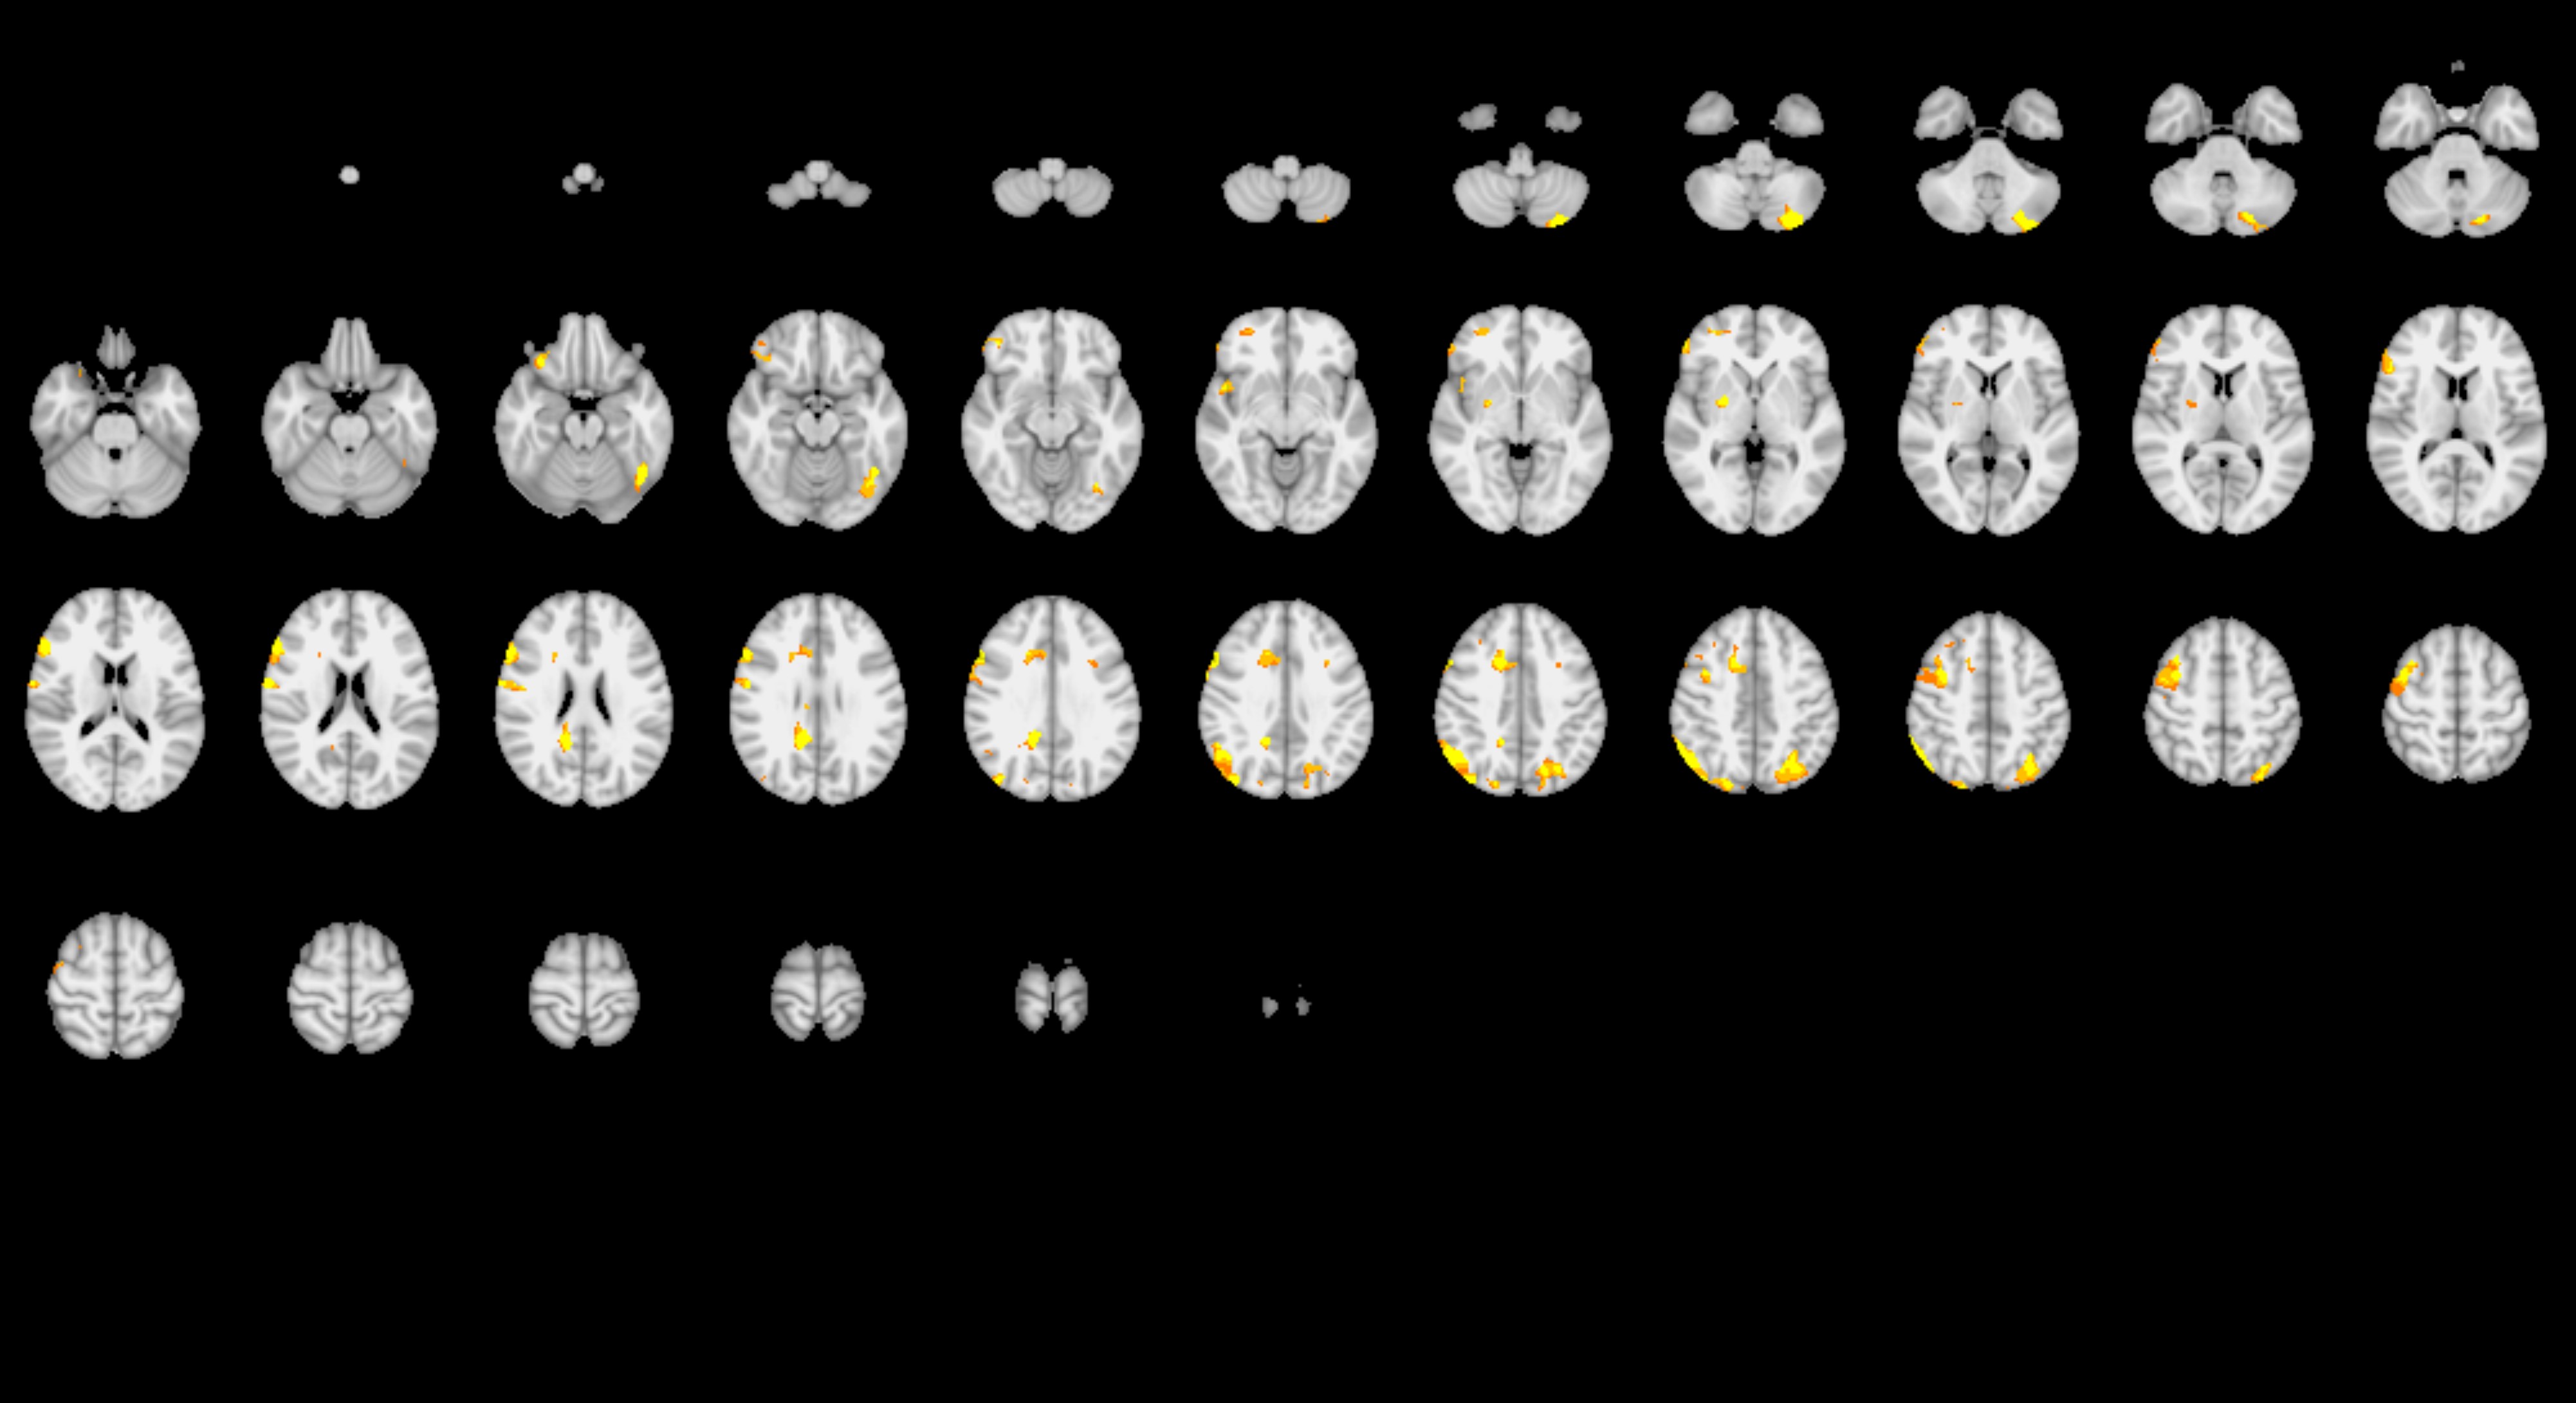
First of all, the raw brain imaging data isn’t assessed by eye. Researchers must use software analysis to process it into pictures, and there are many choices involved. As Roeland Hancock, Associate Director of the UConn Brain Imaging Research Center and assistant research professor in the Department of Psychological Sciences, explains, first the researchers have to pick the software package you want to use to process the data. Then they choose the specific algorithm within that program. Researchers also must choose which confounding factors to account for, and which probably don’t matter and won’t be accounted for. And then there’s the smoothness, or how intentionally blurred the image will be to account for tiny spatial inconsistencies in the data.

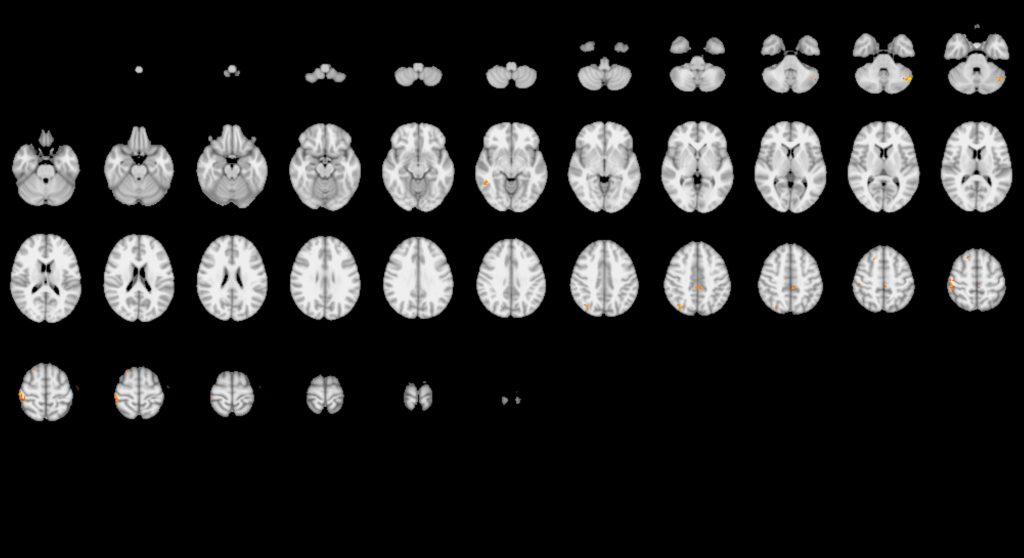
“This shows how variable the results might be even between what we might consider standard methods of analysis,” says Hancock.
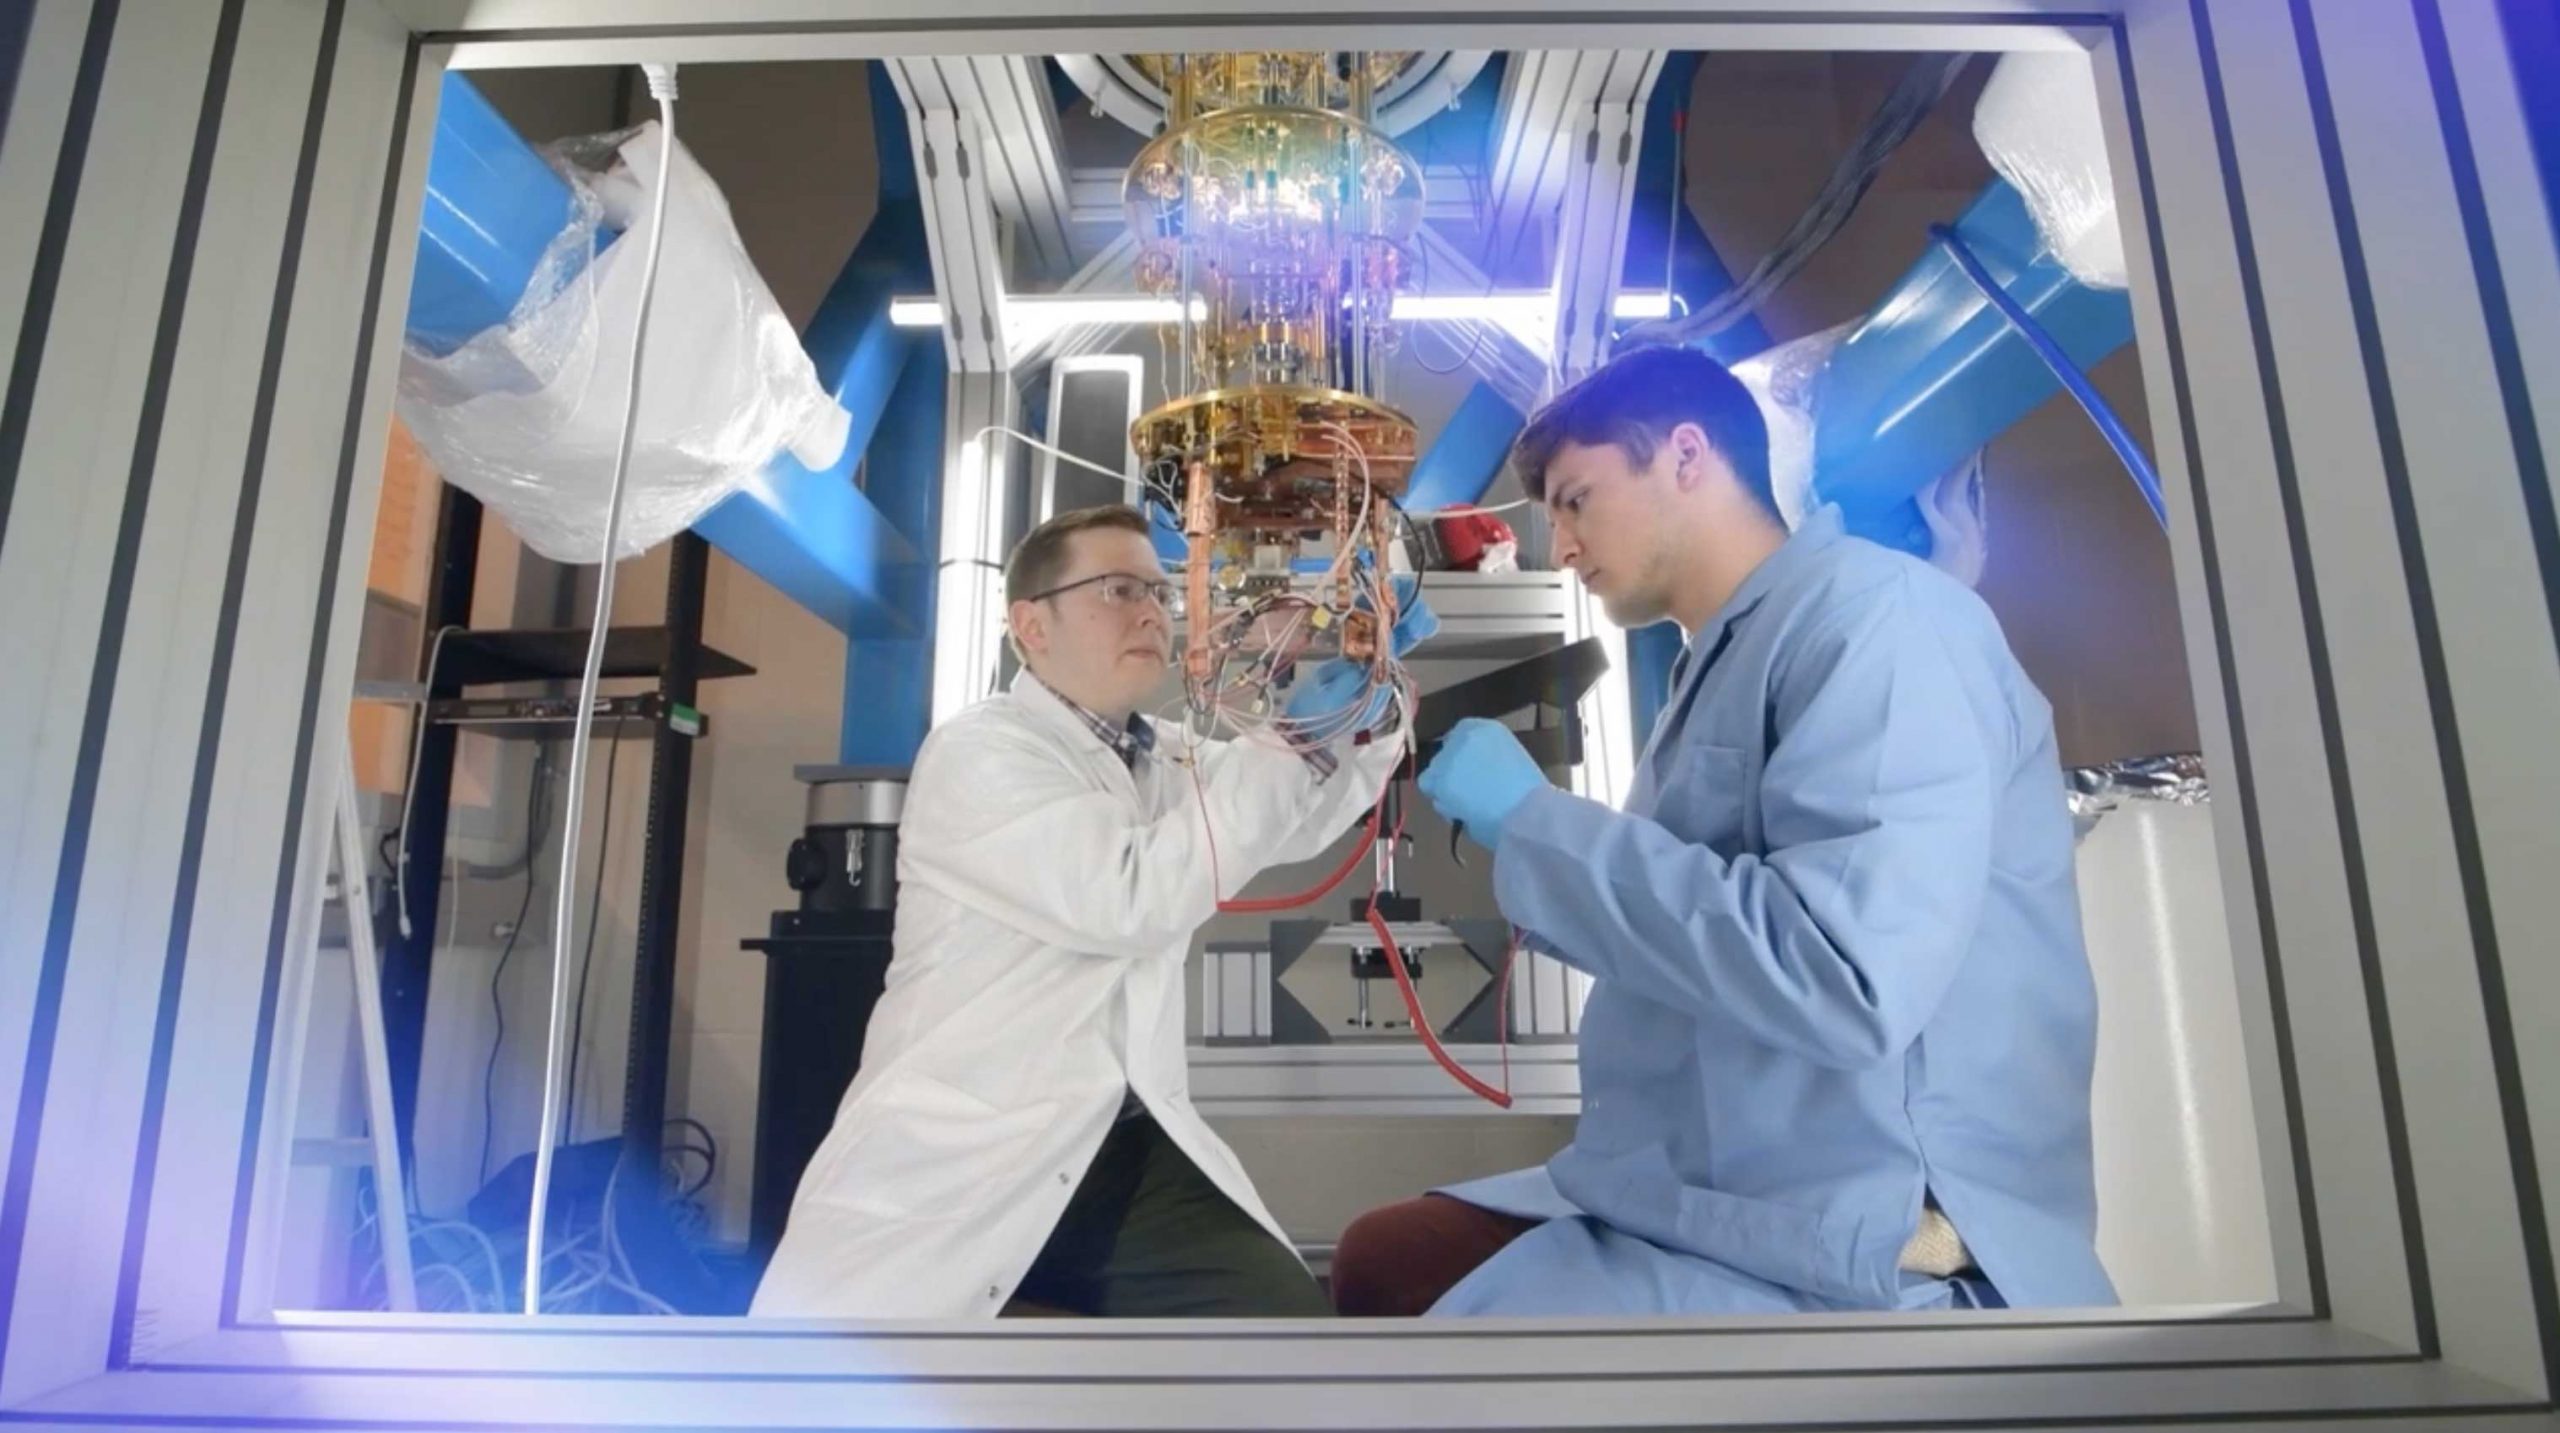
The organizers of the study gave 70 teams, including two teams of UConn graduate students funded by a joint program of the Connecticut Institute for the Brain and Cognitive Sciences and the Brain Imaging Research Center (Charles Davis, Monica Li, Yanina Prystauka, Emily Yearling, and Xu Zhang), the same set of data: fMRI brain scans from 108 people engaged in a money game. Along with the data came a list of true-or-false hypotheses about that data: were, or were not, various specific brain regions engaged in that task?
Out of nine hypotheses, four received very consistent answers on which the majority of teams agreed. But the other five hypotheses received very inconsistent answers.
After analyzing the results from all the teams, the study authors have some recommendations for anyone who wants to do reproducible science: process your data in multiple different ways, then aggregate the results. And ideally, ask someone uninvolved in the research to process your data too.