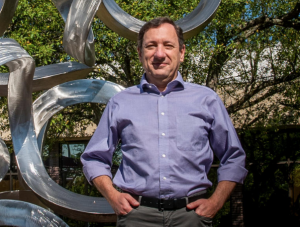
The governors of Connecticut, New York and New Jersey released joint statements on Oct. 20, encouraging people to avoid nonessential travel in the wake of a new wave of COVID-19 cases. Whether a travel ban is warranted or not depends on whom you talk to–but according to UConn Health’s coronavirus model, it’s actually arrived too late. The model is the brainchild of UConn School of Medicine computational biologist Pedro Mendes, public health scientist James Grady, and biomedical informatician Dirk Stanley. They began using UConn Health’s supercomputing resources last spring to help John Dempsey Hospital manage its resources during the first wave of infections. In this Q&A, UConn Today caught up with Mendes to learn more about how the model works, and what it predicts for later this autumn.
What does UConn Health’s coronavirus model predict for the next month?
I don’t like making long term predictions. However, it seems like we’re going to have another wave similar to April, probably in the next month, but it’s hard to predict a peak.
UConn Health’s John Dempsey Hospital had a sharp increase in the number of COVID-19 patients last week. The model actually underestimated the number of cases we got (Oct. 20), which jumped from 11 to 20 in one day. The model had said it would be around 18. It’s very hard to predict the upswing in infections because of the nature of exponential growth: 1, then 2, then 4, then 8, then 16, then 32 … you don’t see it coming, until you see it spike.
My best hope is that this increase is just a fluctuation, a super-spreader event.
What do you mean by a “super-spreader event”? Aren’t super-spreaders people?
No, people aren’t super-spreaders! It’s really circumstances or situations, like a party. Events make super-spreaders. And the super-spreader events are why it’s important to have a stochastic model. Out of 100 people who get COVID-19, maybe 85 give the disease to no one else. The rest give it to only one person, except for one or two people who attend an event and give it to a lot of people at once. The spreading process is stochastic, so we have to model it that way.
What do you mean when you say “stochastic”?
Stochastic means the model isn’t deterministic like an equation that always gives the same result from the same starting place. Instead, a stochastic model involves probability. For example, right now we have a term for the number of COVID-19 cases that come from out of state. Right now it’s about 20. But the model doesn’t always use exactly 20 for that value; instead, it draws a random number centered around 20. Could be 22, could be 18, could be 9. It draws other random numbers for other terms. And we run the model 1,000 times each day. Each gives a slightly different result, which we map on a graph to show the range of possible COVID-19 patient numbers in the hospital on any given day in the future.
What are the terms?
The terms refer to groups of people in the model. People who haven’t been infected but are susceptible; they’re the first term.
Then there are people who are infected but we don’t know about them yet; some of them have symptoms, some don’t. That’s two and three.
And then there are people who are infected and we know about them; some are in the hospital, some are symptomatic at home, some are asymptomatic at home. That’s terms four, five, and six.
Then there are the healed and the dead, who will not pass the infection onwards anymore. Seven and eight. The model picks a random number for each of these terms (centered around the most likely value) every time we run it.
Wait—can’t the healed get reinfected?
We know there are reinfections, but they seem to be extremely rare. Right now the model is working well with that assumption. But the big question is how long immunity lasts.
That’s why the herd immunity strategy is totally crazy, because it assumes immunity forever. And because if we follow it we will have millions of people dead.
Usually you model chemical reactions. What inspired you to make an epidemiological model?
Back in March, John Dempsey Hospital had only a few days worth of personal protective equipment (PPE) in stock. They were worried they’d have to ration it, so they wanted to be able to predict how many patients they were going to have. They knew at UConn Health we host a powerful supercomputer and have a lot of modeling expertise, so they approached us and after a discussion with the hospital epidemiologist, David Banach, we started to make the model.
The main model is for the entire state. I then take that model and apply it to just the data for Hartford County. Then I split hospitalized patients into two groups: John Dempsey and other hospitals. That’s how I narrow the model down to just John Dempsey Hospital.
Right now we’re in a much better position than we were in March with regards to PPE. We have months’ worth of PPE now.
To the casual observer, the model’s future prediction doesn’t look very sophisticated. I could probably draw that graph by eye, just following the trend.
True! The model’s not so much a prediction as a way for us to understand why things happen the way they do. For example, for most of the summer the model predicted the extinction of the epidemic in Connecticut in August. But that never happened. It forced me to think about why; that’s when I added the term for people entering the state with COVID. The 20 infections per day from out of state number was picked because it fits the data.
That’s a compelling argument for a travel ban, isn’t it?
Only at low levels of spread. Right now, if I remove that term, the model shows that the epidemic will keep on growing. As soon as you start to see cases, it’s too late for a travel ban to help.
The governors’ announcement doesn’t make a big difference now, except it lets people know this is serious: it’s not just business as usual like in July, August, September. We need to take the increase seriously.
Do schools have anything to do with the spread of the virus?
I cannot tell for sure. But there is an incredible coincidence in the timing. The curve began to increase on Sept. 23, two weeks after schools opened. But people also started eating in restaurants, going to gyms at the same time … probably opening schools was part of a totality of things that lead people to let their guards down. The data on whether school children spread COVID is incredibly unclear.
Is there anything that worries you about the COVID-19 data you are seeing from the model or elsewhere?
Right now, our numbers in the United States are not really that far off from October 1918 during the flu pandemic. The majority of people who died in that pandemic died in January and February 1919. And we (as a country) are making all the same mistakes they did then.
But Connecticut is better. We should probably go back to doing what we were doing in March and April: distance, wear masks, and practice good hygiene.