
As the world watches scientist and policymakers working to manage a global crisis, looking at how a similar challenge was successfully addressed can be a source of encouragement.
This success story starts in 1963, an eventful year for the world. The United States’ involvement in the Vietnam War was growing, the civil rights movement was forging ahead, and in November, President John F. Kennedy was assassinated. It was also the early days of the modern environmental movement, just one year after Rachel Carson’s pivotal “Silent Spring” was published, and the year acid rain was discovered in North America, when researcher Gene Likens began a decades-long undertaking to measure and understand the problem.
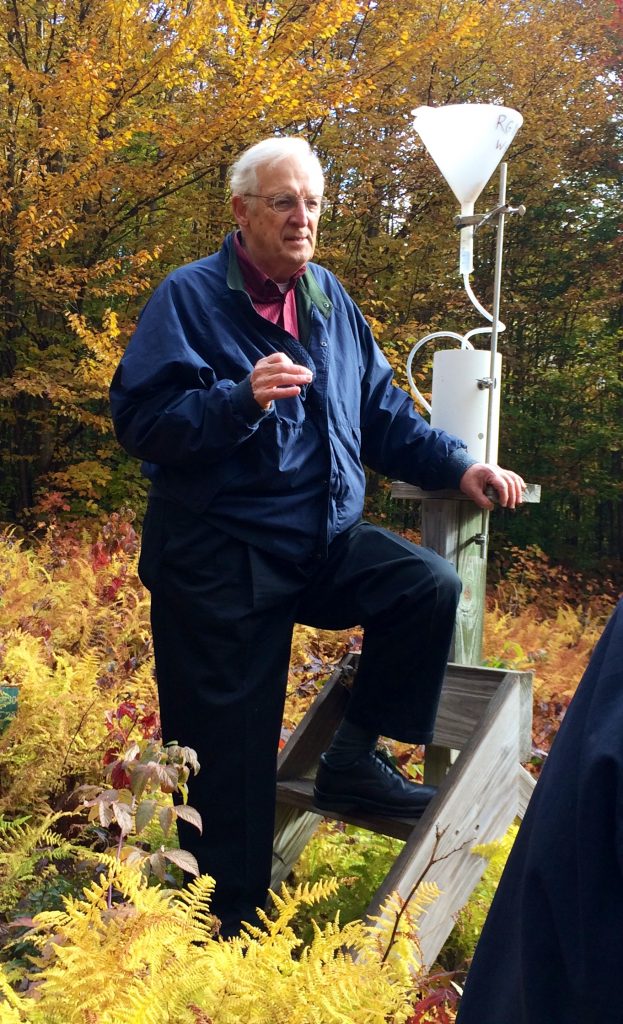
Likens, now Distinguished Research Professor in the Department of Ecology and Evolutionary Biology and Emeritus at the Cary Institute of Ecosystem Studies, has published, along with colleagues, an analysis and summary in Atmospheric Environment of what became a national monitoring program for precipitation chemistry. After its discovery in the US, these researchers and others realized the need for a concerted effort to understand and tackle the challenges posed by acid rain.
“We argued early on that we needed a national network to try to understand what was going on. Data from these early networks and their successors provided the foundation for our long-term analysis,” says Likens.
Measurements began at the Hubbard Brook Experimental Forest in June 1963, followed by the establishment of the Multi-state Atmospheric Power Production Pollution Study (MAP3S) Network in 1976, and later the National Atmospheric Deposition Program (NADP) network in 1978. In all, the combined networks include over 250 locations across the nation.
“This paper was an attempt to put all of these data together and analyze the long-term, precipitation chemistry and make conclusions about what that record showed. The data collection has been consistent and that gives credibility; that consistency allows us to produce an impeccable record,” says Likens.
One of the outcomes the researchers show is a good example of how communicating scientific data can inform effective policymaking.
“Our analysis showed there has been a remarkable decline in polluting sulfur concentrations and acidity,” says Likens. “That is a real success story.”
Likens points out that as these data were collected, a concerted effort was made to make them publicly available and to communicate the findings. Research papers, maps, and books on the subject were published and as awareness grew, Likens credits one particularly successful means to visually communicate the acid rain threat to the public,
“I would argue that cartoons with their use of satire — in this case focused on the environmental issue — communicated to the public very strongly.”
The body of data and successful communication of the information led to the Clean Air Act Amendments of 1990, after which emissions plummeted and acid precipitation levels correspondingly declined.
“The declines resulted from federal legislation which reduced the source of the acidity, that is, the emissions of sulfur dioxide and nitrogen oxides to the atmosphere through the burning of coal and oil in the production of electrical power in the Midwest,” says Likens. “These power plants belched out huge amounts of sulfur dioxides and some nitrogen oxides. Federal legislation caused a major decline in these emissions.”
The paper includes startling visual maps of the United States at 10-year intervals showing declines in different components of acid rain. For instance, the eastern portion of the US is colored bright red in 1986, showing high levels of hydrogen ion in precipitation, but by 2016, the entire US is green or light green, indicating significant reductions in hydrogen ion found in precipitation.
For the summary and analysis, the researchers compiled all of the data, including previously unarchived information, and applied high-powered statistics to analyze the trends.
“In putting it all together, the paper contains information on emissions, declines, the maps, and wet and dry deposition all in one place. We tied to put it all together as one coherent story,” says Likens.
Likens stresses that it is important to not forget the success of that legislation and the significance of the science communication behind it,
“These maps show there has been a massive improvement, and are so powerful in showing the public and politicians this success. It’s pretty obvious. That is one of the things we wanted to do is to put all of that together and show the long term record.”
It is important to highlight this story at a time when clean air protections may be relaxed, Likens says. Acid rain is not just a problem for whatever it lands on immediately and it is not an issue that happened only in the past. The downstream impacts have serious consequences. Beyond damage to structures, acid rain changes entire ecosystems for decades.
“One of the major effects of acid precipitation was to strip the buffering capacity out of sensitive soils, for instance the White Mountains of New Hampshire and the Adirondack Mountains of New York, were greatly impacted by acid rain. Loss of buffering capacity has made the soils more sensitive to continuing inputs or increases of acid rain. The Trump administration has proposed rollbacks to emissions controls, and that could have major impacts on those systems which are now much more sensitive than they were back in 1950 when acid rain started,” says Likens.
Rollbacks on emissions controls would quickly lead to further damage to ecosystems only just now starting to recover from acid rain damage from the past: “The Tums and Rolaids in the systems have been used up,” Likens says.
Likens is hopeful this summary and analysis will serve as a reminder of the importance and effectiveness of emissions controls. “The value of these maps is to show the success that has occurred. It took us 18 years to state statistically that rain and snow were less acid than when we started taking measurements at Hubbard Brook.”