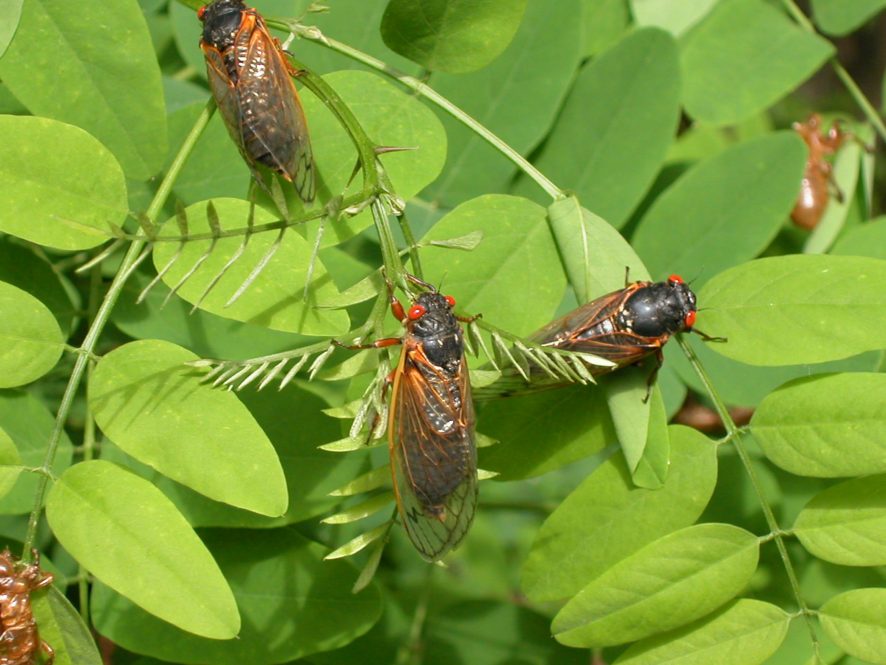
Cicada researchers, enthusiasts, and citizen scientists have an exciting few months ahead of them. The emergence of the Brood X 17-year periodical cicadas this summer is an opportunity to unite a summertime spectacle with new technology to help scientists study trends for this charismatic insect envoy.
UConn Ecology and Evolutionary Biology Professor Chris Simon and her lab studies periodical cicadas, with an interest in their molecular genetics and evolutionary biology. Her long-time collaborator, UConn Assistant Professor in Residence John Cooley, studies their behavior and ecology. Digging into these questions requires a firm understanding of their geographic distribution therefore the researchers need an accurate cicada census.
The processes for mapping and tracking cicadas has evolved over the years, but one thing has remained the same, says Cooley: “Crowdsourcing and citizen science have been parts of this story from the very beginning, going back to the 1600s.”
It is a big task to track the millions of cicadas emerging every 13 or 17 years and whatever technology is available at the time has played a part in describing the phenomena, including written accounts, postcards, telegraph messages, phone calls, and more recently, email and an app.
With each innovation comes more data, which can be a mixed blessing, says Simon, recounting the data gathering for an emergence of Brood II in 1979.
“I published a story in Natural History Magazine out of the American Museum of Natural History. I got hundreds of letters and post cards from people, and then I had to go through all of those and answer them by hand. I used to have to contact every agricultural extension agent in every county a brood of cicadas occupied and ask them to gather information. I had to go to the county courthouse, meet the agent, pick up a map of each county, get the phone numbers and address for people who reported, and then drive around to each house or farm.”
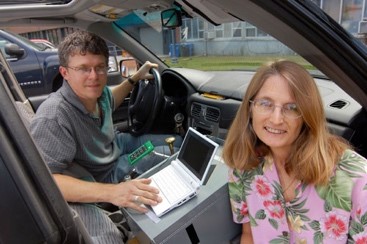
Simon points out that Cooley had an important hand in revolutionizing how cicadas are mapped.
“He invented an automated data logger and protocols for using it. Then he made a website where people could report sightings. We were finding records that we never knew about in the past. Before we were just marking things on maps by hand and it was difficult to translate that into a quality data,” says Simon.
Cooley explains the resulting map is currently the most accurate, but it is still incomplete. However, the Cicada Safari app, developed by collaborator Gene Kritsky at Mount St. Joseph University, promises to further streamline and refine the process of producing more accurate maps.
“Many of the older maps suffer from the problem of lack of resolution. We like to say that they’re at the county level, which means that if a county is tagged as having the cicadas in it, they may have been found anywhere in that county. Some counties are hundreds of square miles, and so a county level series of maps will suggest degrees of overlap between groups of cicadas that are not actually happening,” Cooley says.
This is a case where the researchers note a misleading map is worse than no map at all.
“Distribution is quite patchy and regional. To my knowledge, no other cicada map that you can find on the web is based on individual records like ours is,” Cooley says.
An accurate map will provide a launching point for so much more research, says Cooley. “In our research, we’re interested in questions of species and speciation and how species interact. With periodical cicadas, you need to know where and how different groups come into contact.”
Another area of interest, Simon says, is in learning more about straggler populations: “We are especially interested in records of early cicadas that emerge four years early, or four years late. These days it is mostly four years early, because of climate warming. We are also tracking local extinctions.”
Tracking the brood ranges more precisely will help researchers understand these and other factors impacting the populations. Cooley says, “The broods do change, and logically they have to change because they’re occupying areas that were once glaciated, so it follows that they have to be able to move around. It’s just that it can be hard to catch that. Once you have good baseline maps, then you can spot things that you might see in response to climate change, or development. We are in a phase of the project where we can start to spot changes, because for every brood we have geo referenced dots, we go back in our database and say on this date, at this time, this is what we saw. And if it’s any different now, it changed.”
“We also need to know once the cicadas come out, if they stay out, if they’re singing, and if they’re laying eggs,” says Simon. “The density and persistence of the emergence is key information for our research and is something we are hoping to capture with the crowdsource data.”
Anyone hoping to be part of the data gathering effort can take heart: although there won’t be an emergence in Connecticut this summer, the brood will be in areas not too far away. “You’ll be able to find them, as I like to say, from D.C. to Danville and from Ann Arbor to Georgia,” says Cooley.
It is easy to get involved! The first step is to visit www.cicadas.uconn.edu to find the map and see if Brood X will be emerging near you. Then download the Cicada Safari app to help collect data and have a hand in creating a more detailed map.