Like an expertly choreographed dance, the sequence and timing of natural events through a season, called phenology, give us clues about how the climate is changing.
For example, a warmer spring may lead to plants leafing and flowering early, potentially disrupting life cycles of the birds and insects who may miss this crucial window if it happens before they migrate. Climate change is throwing such timing out of balance, and unless it directly impacts humans, we may not notice.
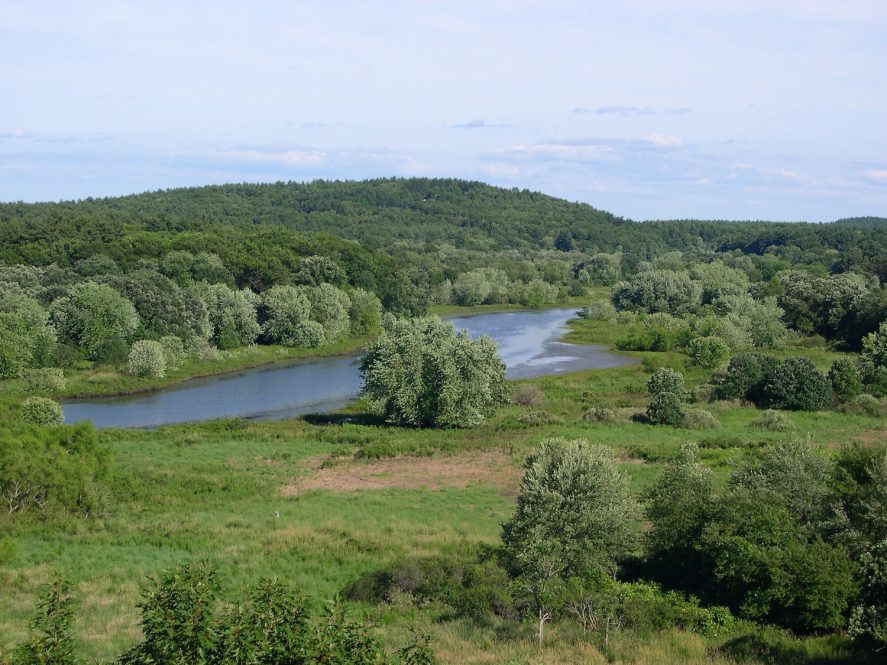
To study New England’s regional phenology through a historical lens, UConn Department of Earth Sciences Professor Robert Thorson is looking into 10 years’ worth of Henry David Thoreau’s meticulous, systematic records of river behavior from the 1850s to glean insights into climate change. His findings are published in The Concord Saunterer.
A season is much more than a block of a few months on the calendar; it is a category of phenomena that varies depending on who you ask, says Thorson. For instance, a season differs if you ask a skier, a fisherman, or a student. To understand something as complex as climate change on a personal level requires helping them see that their seasons are being changed and time-shifted, no matter how they define them. This requires a well-established baseline with a clear definition for each season. Thoreau’s “Journal” provides exactly this.
“I don’t pick Thoreau for his philosophy, he’s just a damn good observer,” says Thorson. “He is meticulous, he is daily, he is yearly, and he is systematically rigorous about roaming around 50 square miles and recording it day after day after day after day.”
Thoreau created an impressive data set from 1850 through 1860, including the 6,000 entries Thorson has cataloged so far by reading line-by-line, indexing, and creating a spreadsheet. Thoreau recorded examples of phenology along the river – for instance, when the first ice occurred, when the river was completely frozen, when the first snow fell, and when the breakup of ice occurred.
“From these observations, we can establish the timings of discrete phenomena from the mid-19th century using simple statistics,” says Thorson. “The next step is to compare those timings with the modern era using publicly available data; for example, minimum stream discharges from the U.S. Geological Survey.”
Rather than seeing the year on a calendar, Thorson categorized how Thoreau saw not four, but ten discrete seasons whose exact dates were fluid and based on the physical conditions he observed rather than celestial happenings or arbitrary dates. These seasons included breakup, inland sea, aquatic spring, riparian spring, summer, drought, aquatic autumn, riparian autumn, freeze up, and winter white. Thorson details the timings and characteristics of Thoreau’s river seasons using hundreds of direct, dated, and descriptive quotes. Thorson notes that all of Thoreau’s seasons still exist today, though they have shifted in timing and intensity due to climate change.
Thorson’s idea is to create a then-and-now comparison and to incorporate statistical analysis between Thoreau’s and modern data sets to understand patterns and trends in the complicated phenomena.
“Even just answering the question of how much earlier ice breakup is occurring would take nothing more than a than simple statistical analysis. This is eminently translatable to the public because many residents of Thoreau country have experienced river breakup in the past,” says Thorson. “They may have had their dock ripped out by river ice, they may have gone swimming on a certain day, but not others. People could relate to this stuff, and that’s essentially what I’m trying to do.”
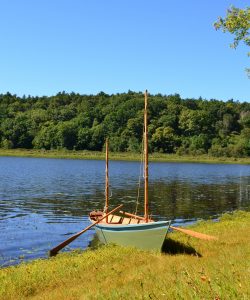
Though Thoreau is remembered primarily for his writings while living on Walden Pond, Thorson points out that he actually spent most of his time on three local rivers, whether walking trails, boating, swimming, or skating.
“This is a guy who skated 60 miles in one day — upriver to the falls at Framingham on the Sudbury River and then he turned around and skated past Concord all the way down to just north of Lowell in Billerica. Then he turned around and skated back home again. On another winter, he measured ice floes two feet thick. Imagine those conditions today. Now the river hardly freezes at all.”
Researching this project, Thorson was delighted by the sensory detail of Thoreau’s descriptions. For example, on one August day, he felt the baking “dog-day” heat of the air, the silence of laminar streamflow, the “unctuous” iridescent sheen on sluggish water, and the fetid smell of riverbank muck draped by dead lily pads, says Thorson.
“But within a day, he can feel fall coming, and all of a sudden, the first rains or the cooling air start to bring change. You get a completely different river from the preceding one of drought, or the one with icebergs stampeding down the river, tearing out bridges. All of this is phenology. All can be timed to a specific day.”
With these phenological details, Thorson has laid the groundwork for creating a record of climate change. Thorson was initially inspired by Thoreau’s phenology when writing his book “The Boatman,” in which he was only able to sketch Thoreau’s river seasons briefly. With this new article, Thorson pulls it all together to identify the specific seasonal thresholds and present the information in Thoreau’s words to show readers how he saw the year. Thorson hopes the paper inspires collaboration with statisticians to help in the next step of analysis.
“Probably the first thing I’ll do is explore where the modern records are. I also wanted to pull the historic record together and tighten portions into a robust hypothesis. Thoreau’s work is New England’s best record of broad environmental conditions for the mid-19th century. It’s astonishing. It’s two million words,” says Thorson.
Noting the contrasts between the river phenology Thoreau so thoughtfully detailed and what we can observe today, Thorson says he hopes this work resonates with readers.
“Breakup is the most instantaneous and dramatic point in the entire year. We don’t think much about it right now, because we don’t have a lot of river ice, but it used to be two feet thick on the river, and that says something sad about how dramatic the climate change has been. You can read dry numerical facts about how New England’s nighttime average temperatures have risen in the 100 years. But when you make climate change dramatic, as with a bridge being torn apart by a spring freshet, that’s a phenomenon associated with emotion. People pay more attention. The personal narrative of a river system year after year after year — that’s what Thoreau gave us.”