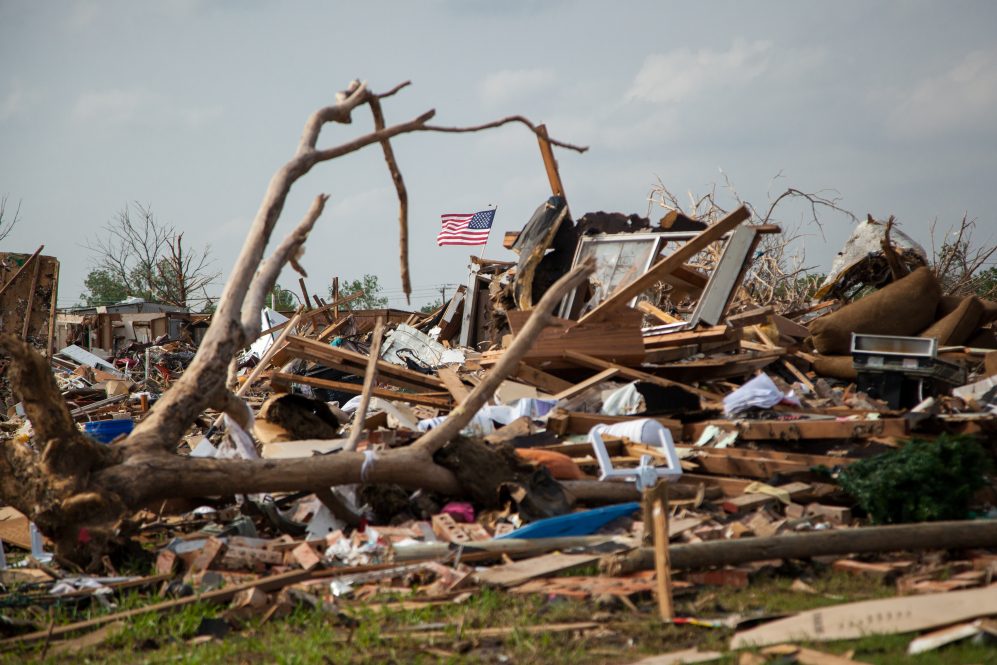
When disaster hits, a quick and coordinated response is needed, and that requires data to assess the nature of the damage, the scale of response needed, and to plan safe evacuations. From the ground, this data collection can take days or weeks, but a team of UConn researchers has found a way to drastically cut the lag time for these assessments using remote sensing data and machine learning, bringing disturbance assessment closer to near real-time (NRT) monitoring. Their findings are published in Remote Sensing of Environment.
Su Ye, a post-doctoral researcher in UConn’s Global Environmental Remote Sensing Laboratory (GERS) and the paper’s first author, says he was inspired by methods used by biomedical researchers to study the earliest symptoms of infections.
“It’s a very intuitive idea,” says Ye. “For example, with COVID, the early symptoms can be very subtle, and you cannot tell it’s COVID until several weeks later when the symptoms become severe and then they confirm infection.”
Ye explains this method is called retrospective chart review (RCR) and it is especially helpful in learning more about infections that have a long latency period between initial exposure to the development of obvious infection.

“This research uses the same ideas. When we’re doing land disturbance monitoring of things like disasters or diseases in forests, for example, at the very beginning of our remote sensing observations, we may have very few or only one remote sensing image, so catching the symptoms early could be very beneficial,” says Ye.
Several days or weeks after a disturbance, researchers can confirm a change, and much like a patient diagnosed with COVID, Ye reasoned they could trace back and do a retrospective analysis to see if earlier signals could be found in the data and if those data could be used to construct a model for near real-time monitoring.
Ye explains that they have a wealth of data to work with – for example, Landsat data stretches back 50 years – so the team could perform a full retrospective analysis to help create an algorithm that can detect changes much faster than current methods which rely on a more manual approach.
“There is so much data and many good products but we have never taken full advantage of them to retrospectively analyze the symptoms for future analysis. We have never connected the past and the future, but this work is bringing these two together.”
Associate Professor in the Department of Natural Resources and the Environment and Director of the GERS Laboratory Zhe Zhu says they used the multitudes of data available and applied machine learning, along with physical barriers to pioneer a technique that pushes the boundary of near real-time detection to, at most, four days as opposed to a month or more.
Until now, early detection was more challenging, because it is harder to differentiate change in the early post-disturbance stages, says Zhu.
“These data contain a lot of noise caused by things like clouds, cloud shadows, smoke, aerosols, even the changing of the seasons, and accounting for these variations makes the interpretation of real change on the Earth’s surface difficult, especially when the goal is to detect those disturbances as soon as possible.”
A key point in developing the method is the open access to the most advanced data available at medium-resolution, says Ye.
“Scientists in the United States are in collaboration with European scientists, and we combine all four satellites, so we have built upon the work of many, many others. Satellite technologies like Landsat – I think that’s one of the greatest projects in human history.”
Beyond making the images open source, Zhu adds that the data set – NASA Harmonized Landsat and Sentinel-2 data (HLS) — was harmonized by a team at NASA, meaning the Landsat and Sentinel-2 data were all calibrated to the same resolution, which saves a lot of processing time and allows researchers to start working with the data directly,
“Without the NASA HLS data, we may spend months to just get the data ready.”
Ye explains they set thresholds based on empirical knowledge from what was seen in previous land disturbances. They look at signals in the data, called spectral change, and calculate the overall magnitude of change to help distinguish the noise from the early signals of disturbances. This approach ignores other relevant important disturbance-related information such as spectral change angle, patterns of seasonality, pre-disturbance land condition, says Ye.
“The new method lets the past data supervise us to find the real signals. For example, some disturbances occur in certain seasons, so similarity could be taken into account, and some disturbances have special spectral features that will increase at certain bands, but decrease in other bands. We can then use the data to build a model to better characterize the changes.”
On the other hand, we took advantage of numerous existing disturbance products that could be used as training data in machine learning and AI, says Zhu.
“Once this massive amount of training data is collected, there can be some wrong pixels, but this machine learning approach can further refine the results and provide better results. It’s as if the physical, statistical rules are talking to the machine learning approach and they work together to improve the results.”
Co-author and Postdoctoral Researcher Ji Won Suh says the team is eager to continue working on this method and to monitor land disturbances nationwide.
“For future directions, I hope we can help to tell the story about socio-economic impacts and what is going on in our earth system. If denser times series data are available, and more data storage is available, together with this algorithm, we can understand our system more intuitively. I’m very much looking forward to the future.”
Zhu says the approach is already attracting interest, and he expects the interest will grow. Their work is open source and Zhu says they are happy to help other groups adopt the method. The platform has already been used for near-real-time disaster monitoring. In the aftermath of Hurricane Ian, the team quickly employed this method to aid in the recovery efforts.
“I think it is extremely beneficial,” says Zhu. “If any kind of disaster happens, we can see the damage in the area quickly and determine the extent and the estimated cost for recovery. We’re hoping to have this comprehensive land disturbance monitoring system in near real-time to help people reduce the damage from those big disasters.”


