This post is part of a series about the research of faculty members who are seeking to understand the impact of climate change here in Connecticut, and to work toward environmentally sustainable solutions.
Connecticut is home to an abundance of wildlife and one doesn’t have to go far to find it. With the unique not-quite-urban, not-quite-rural landscape in much of the state, this means humans are living among wildlife, oftentimes in our own backyards.
Keeping track of the animals and their numbers is important information for decision making, management, and conservation for animal populations.
Researchers at UConn are addressing these challenges using new technology and citizen science, to learn more about the animals and the places where both people and wild creatures live.
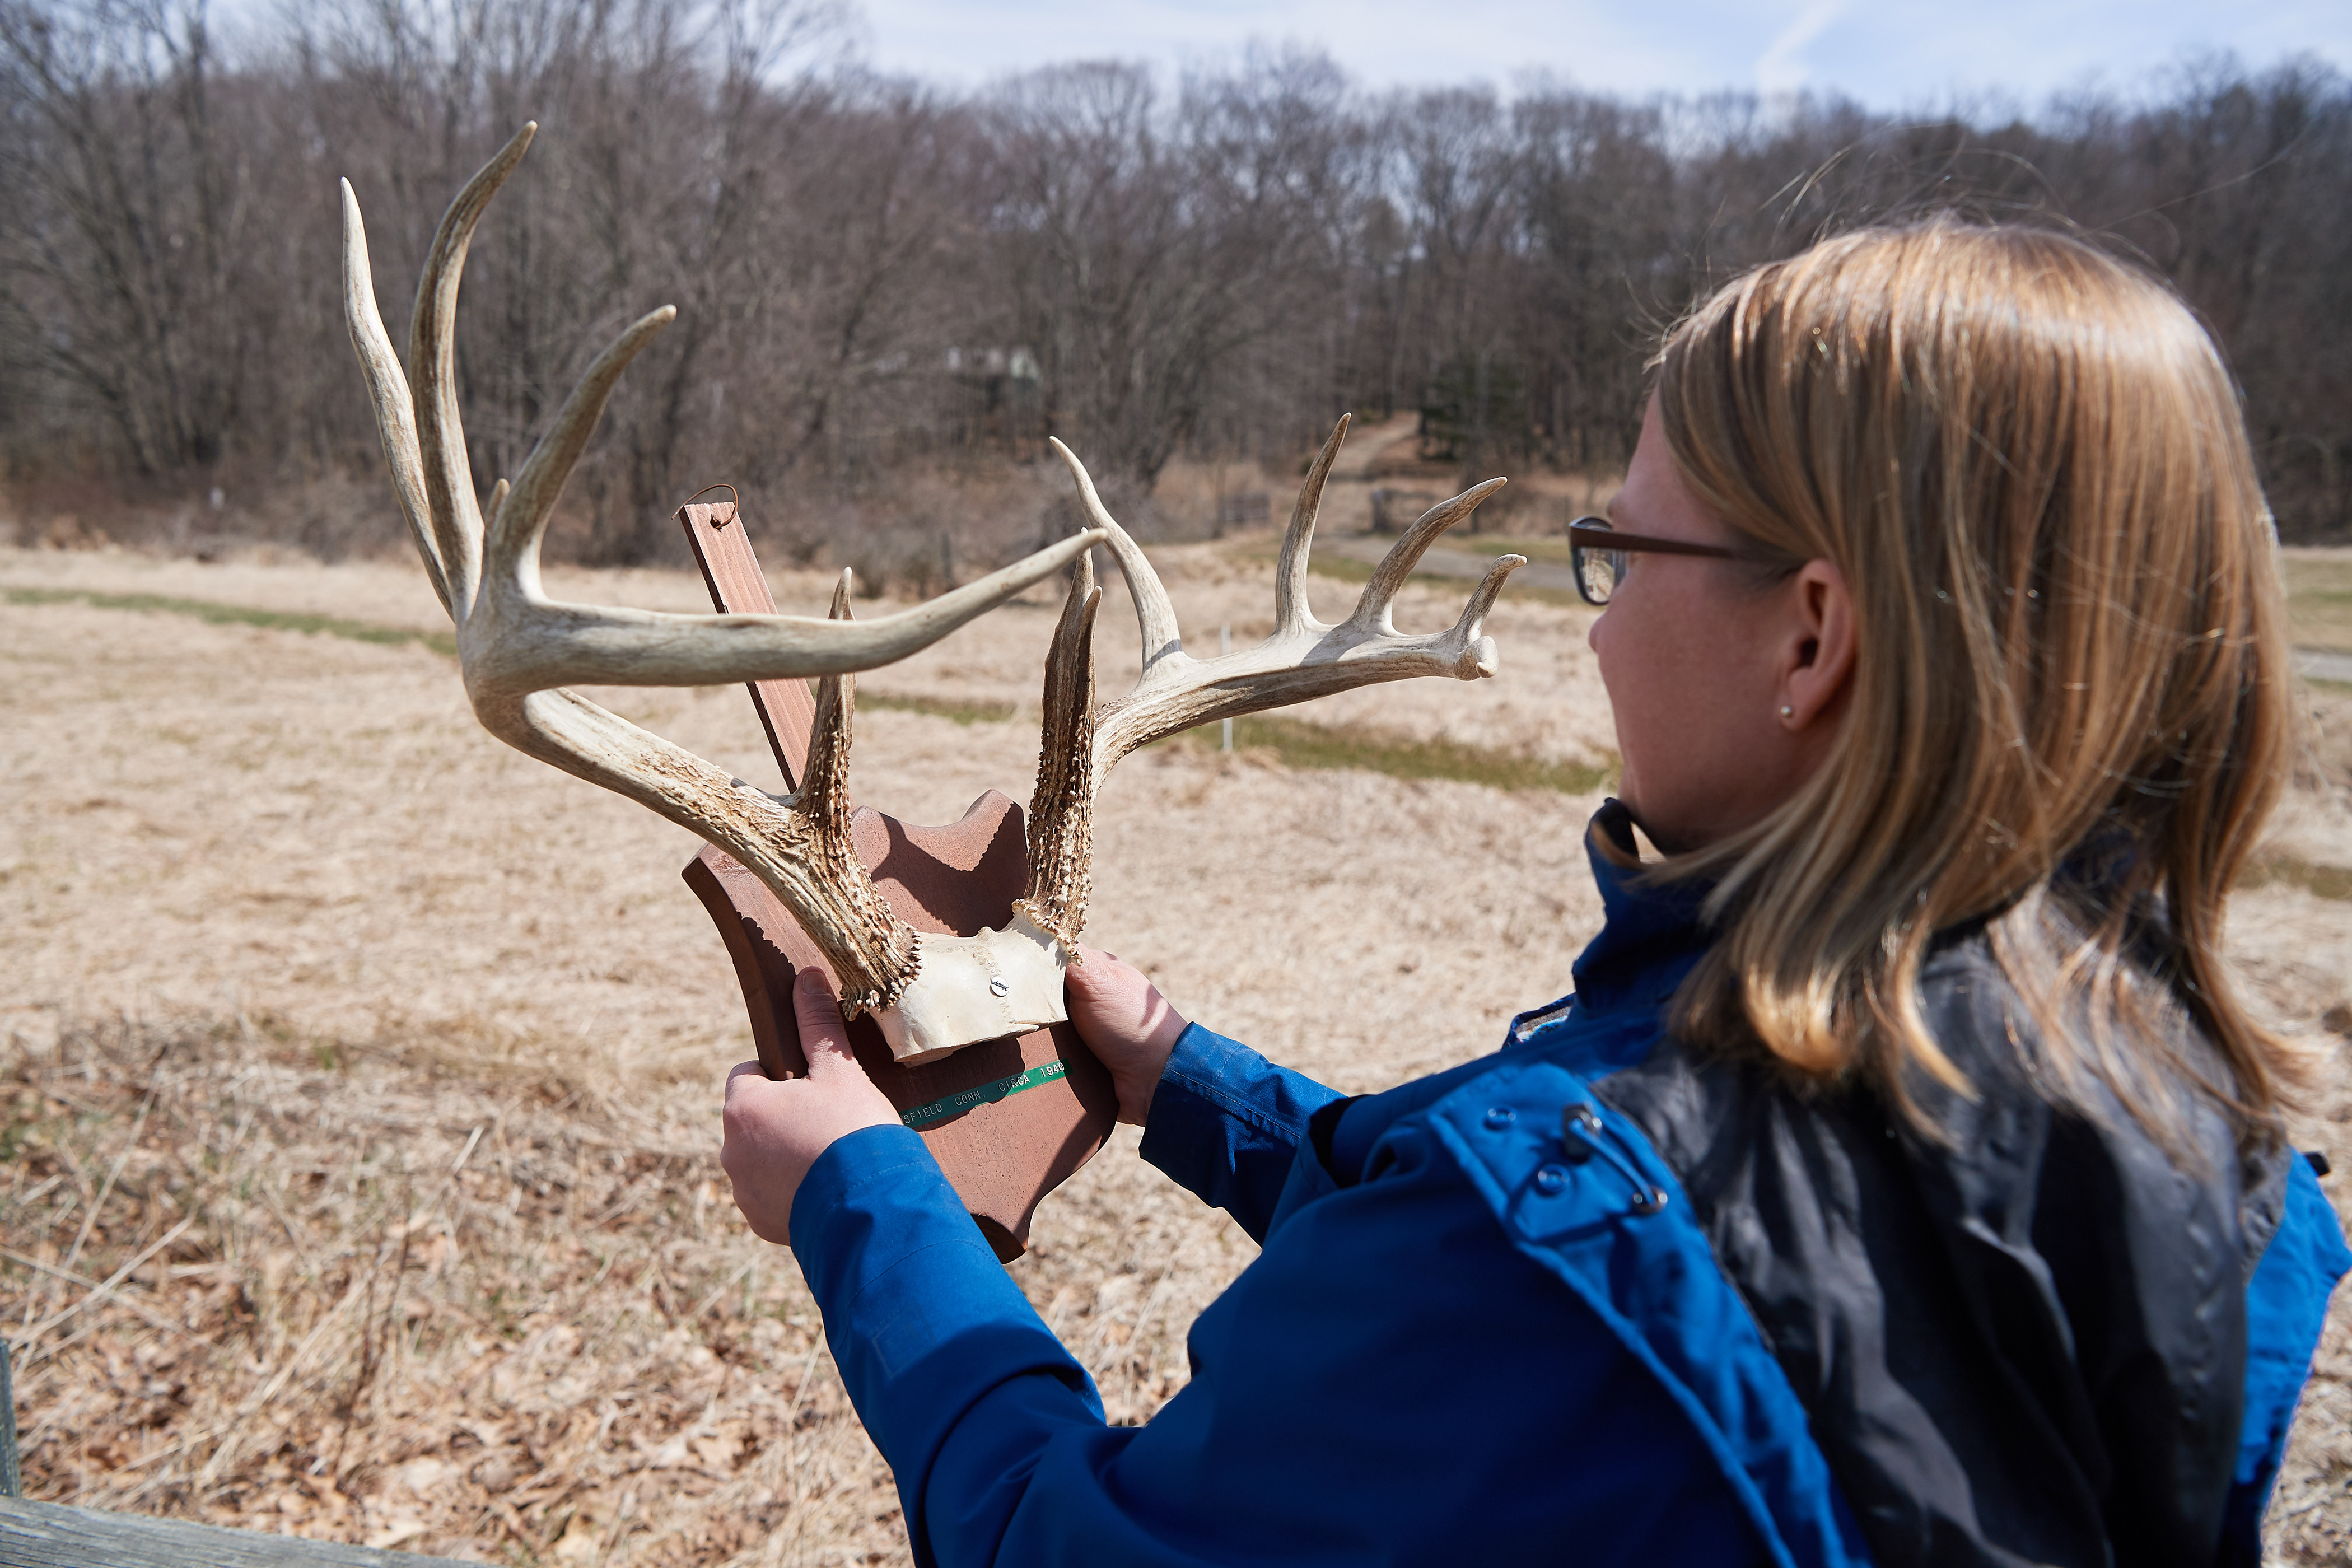
Associate professor of natural resources and the environment Tracy Rittenhouse and researcher Jennifer Kilburn ’18 MS have been tackling the question of how deer density varies across the state, by developing better methods to estimate deer abundance.
“Determining deer abundance can be very labor-intensive and costly in terms of counting, marking, and recapturing,” says Rittenhouse. “One method may work better in one area and not so well in another, so finding the best way to count them to get a good estimate of abundance by using cameras is something we have been working on.”
In terms of abundance, in the northwest hills the population is relatively low, with less than 20 deer per square mile. For areas closer to the shore, deer population densities are more than 20 deer per square mile, says Kilburn.
High deer densities can mean a lot of things for the landscape beyond just the eating of plants, especially native plant species. Deer can also carry ticks, ferrying them and any diseases the ticks may be harboring wherever they go.
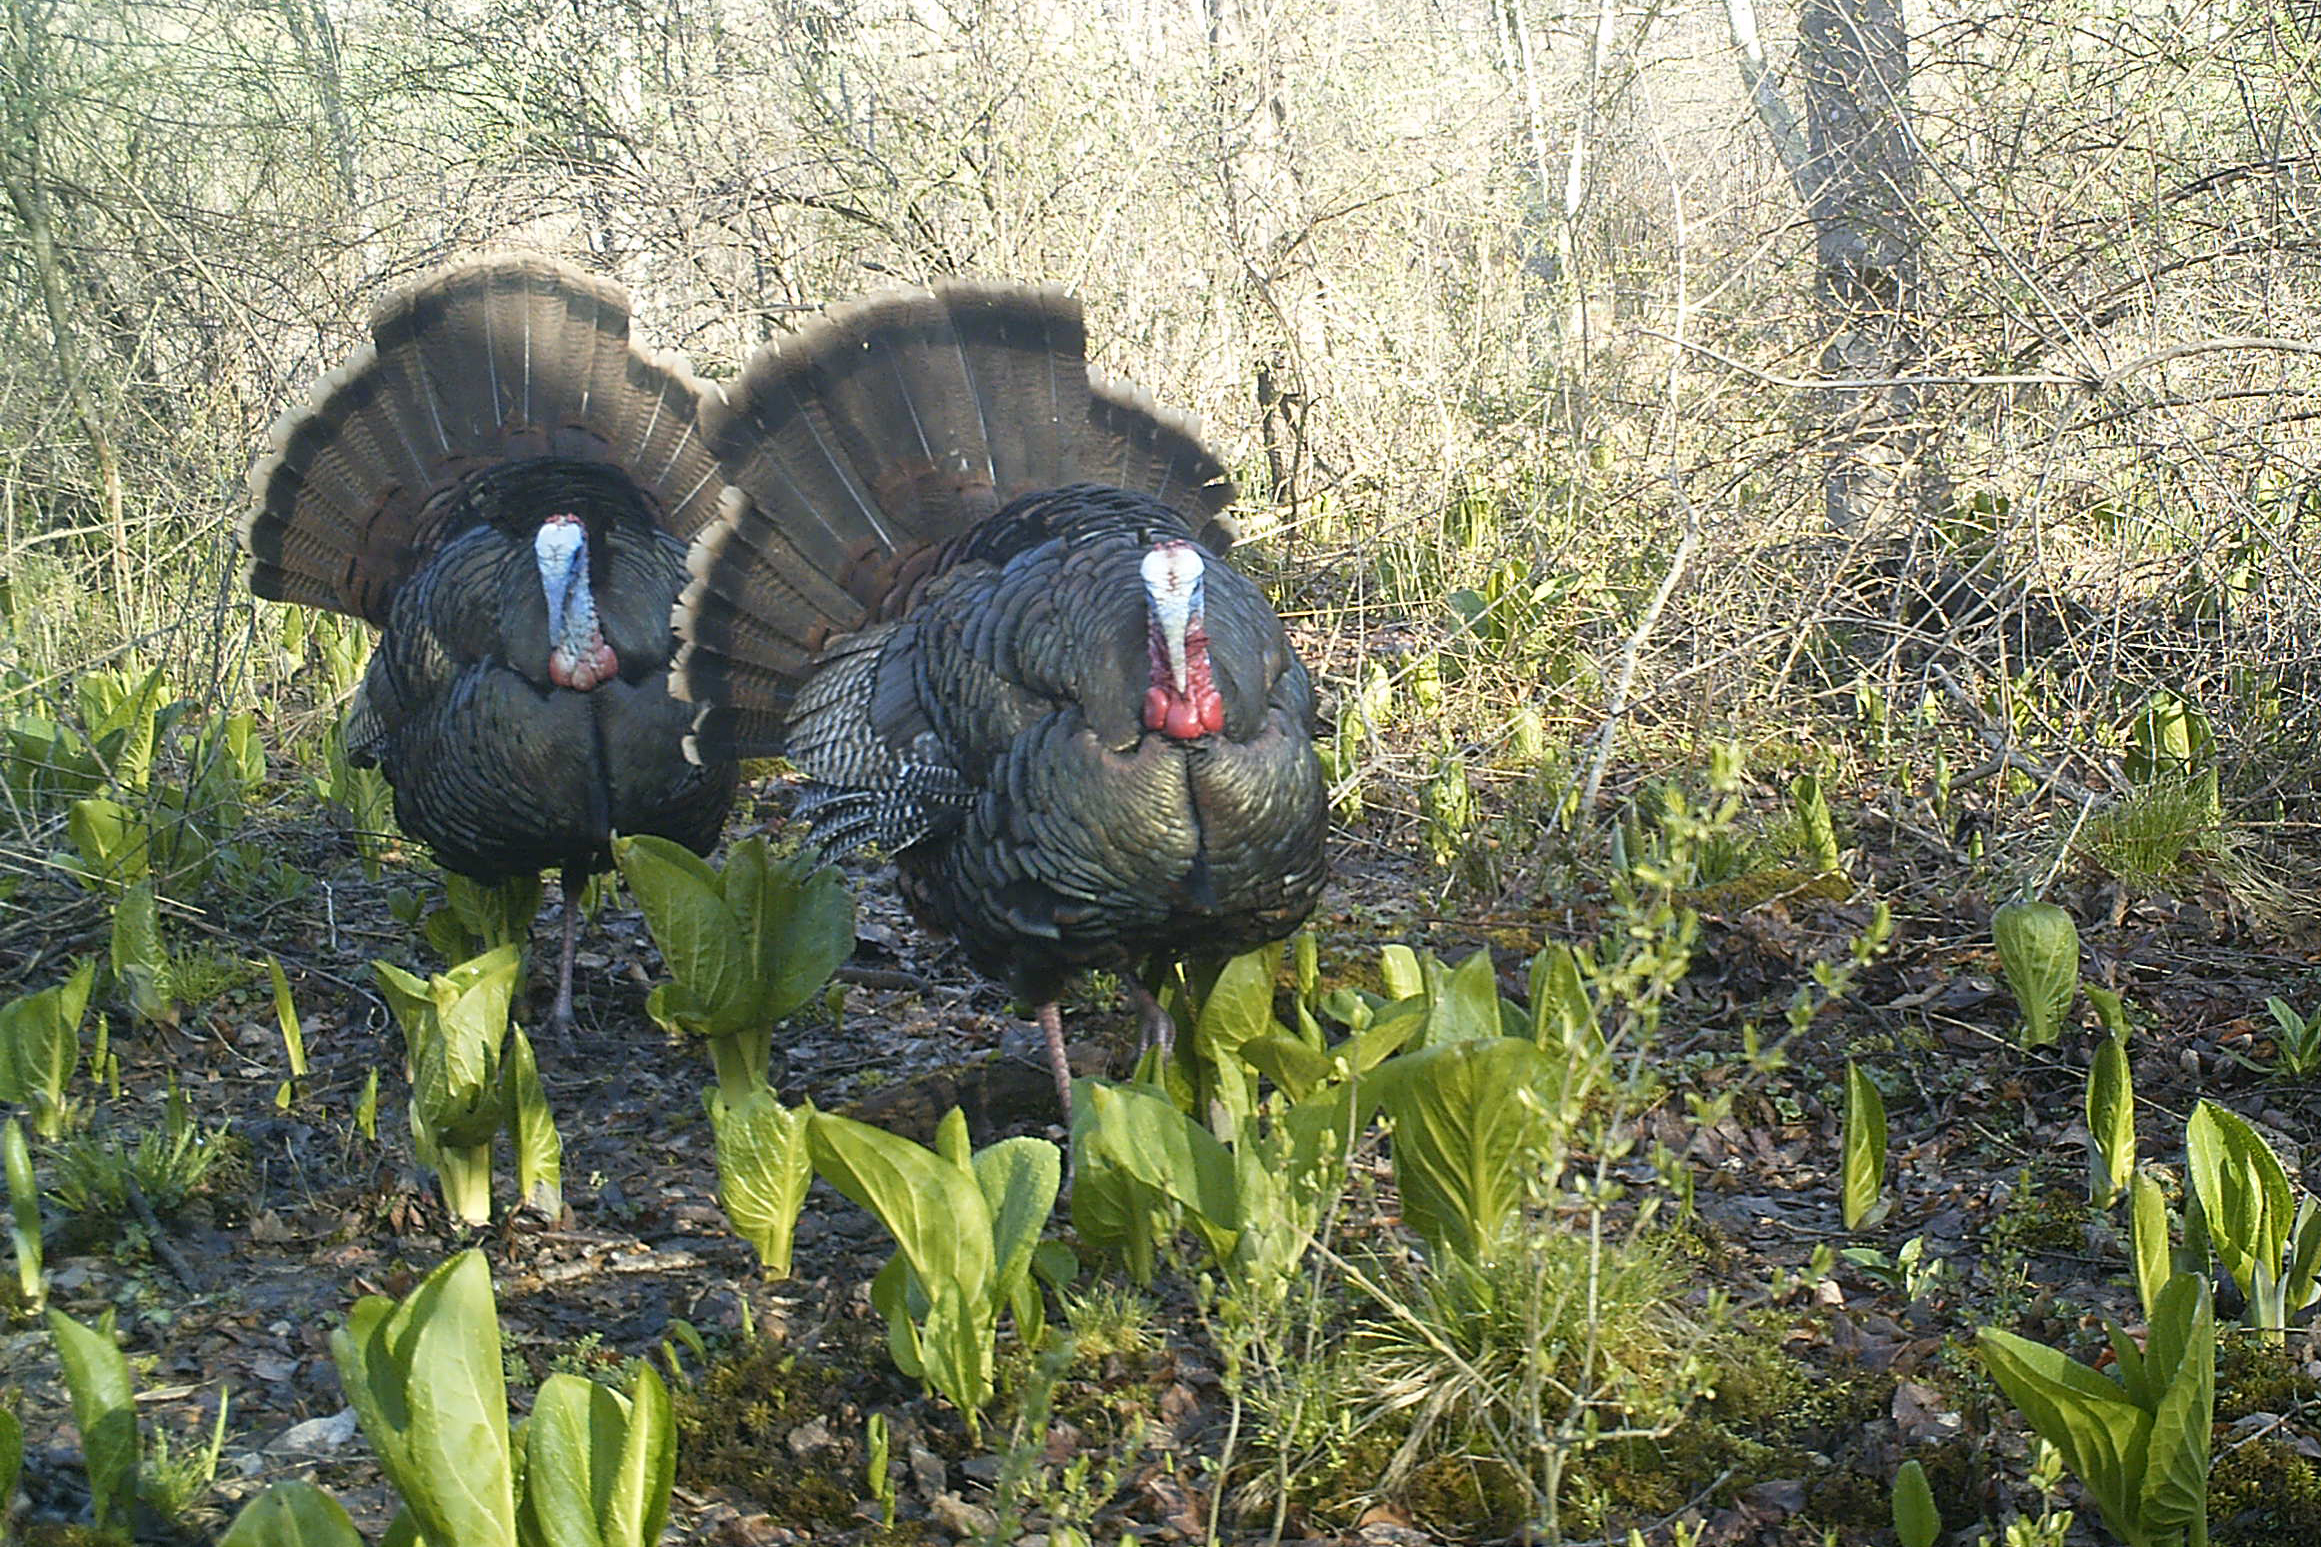
It is often said that the main predators for deer in the eastern U.S. are cars and hunters, and that is true, Rittenhouse says. Hunters play a vital role in natural resource management. Besides helping to keep game populations at healthy levels, hunters supply researchers and natural resource managers with valuable information, for instance, by reporting sightings of other animals while out on the hunt.
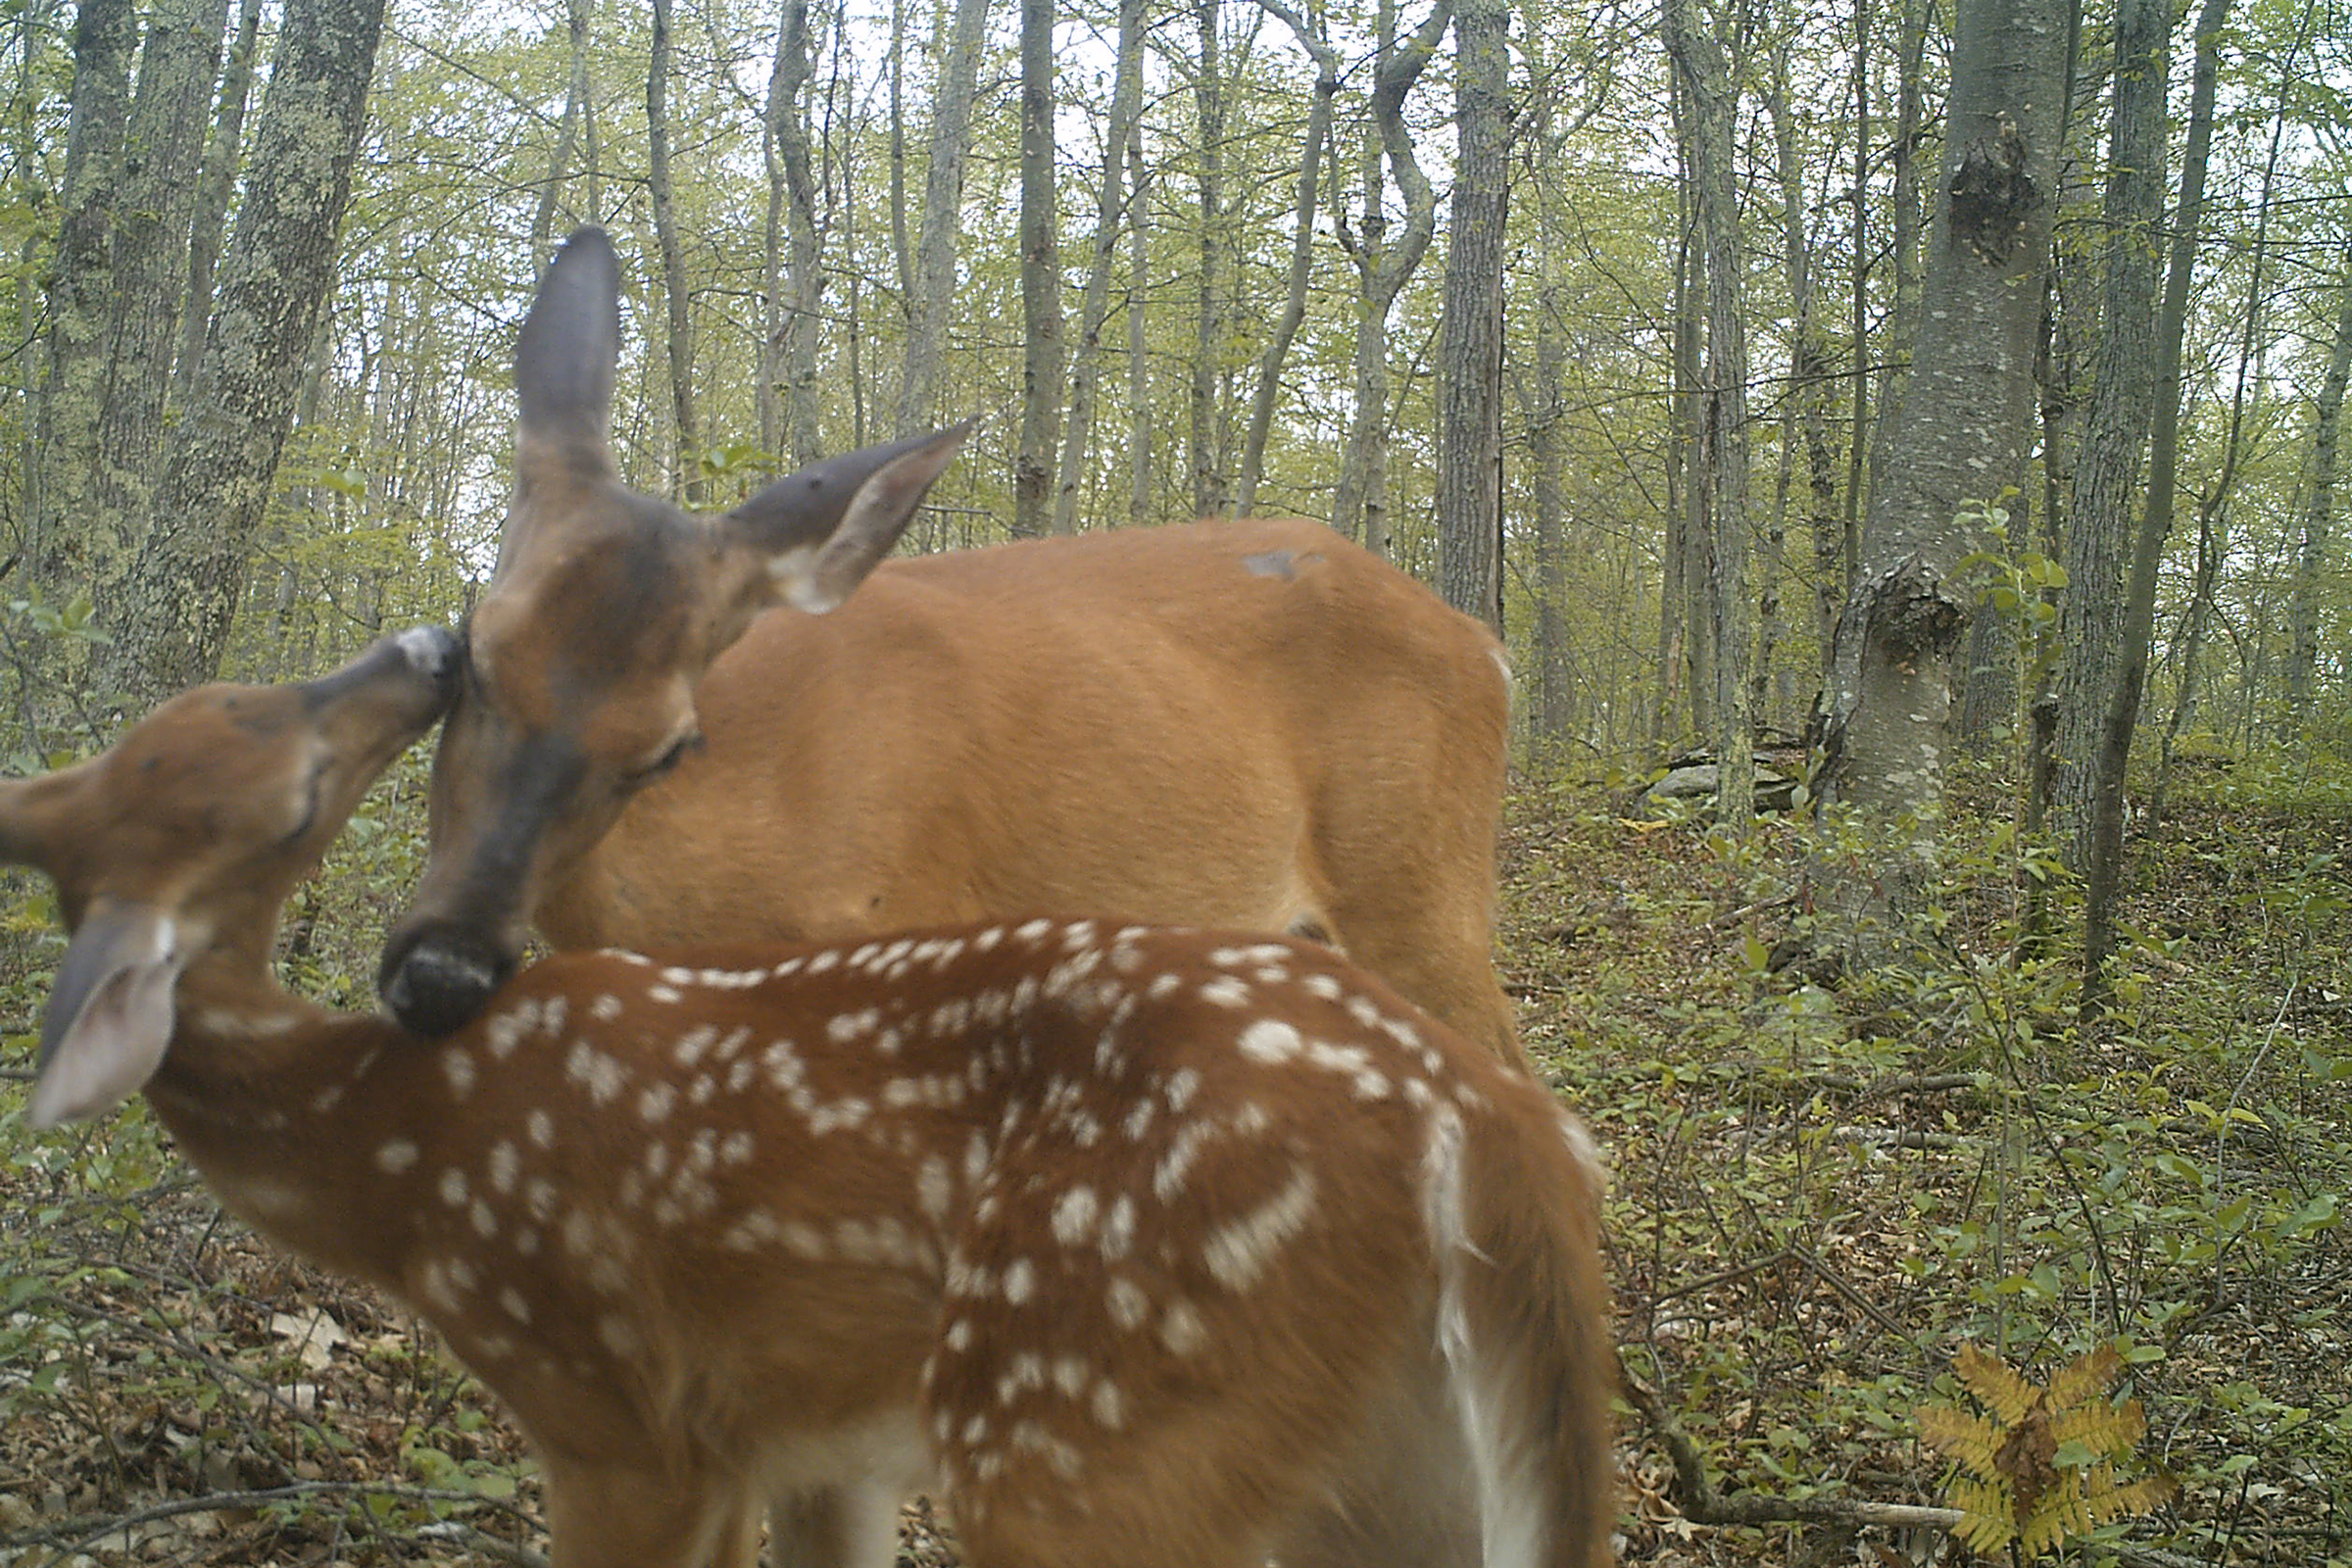
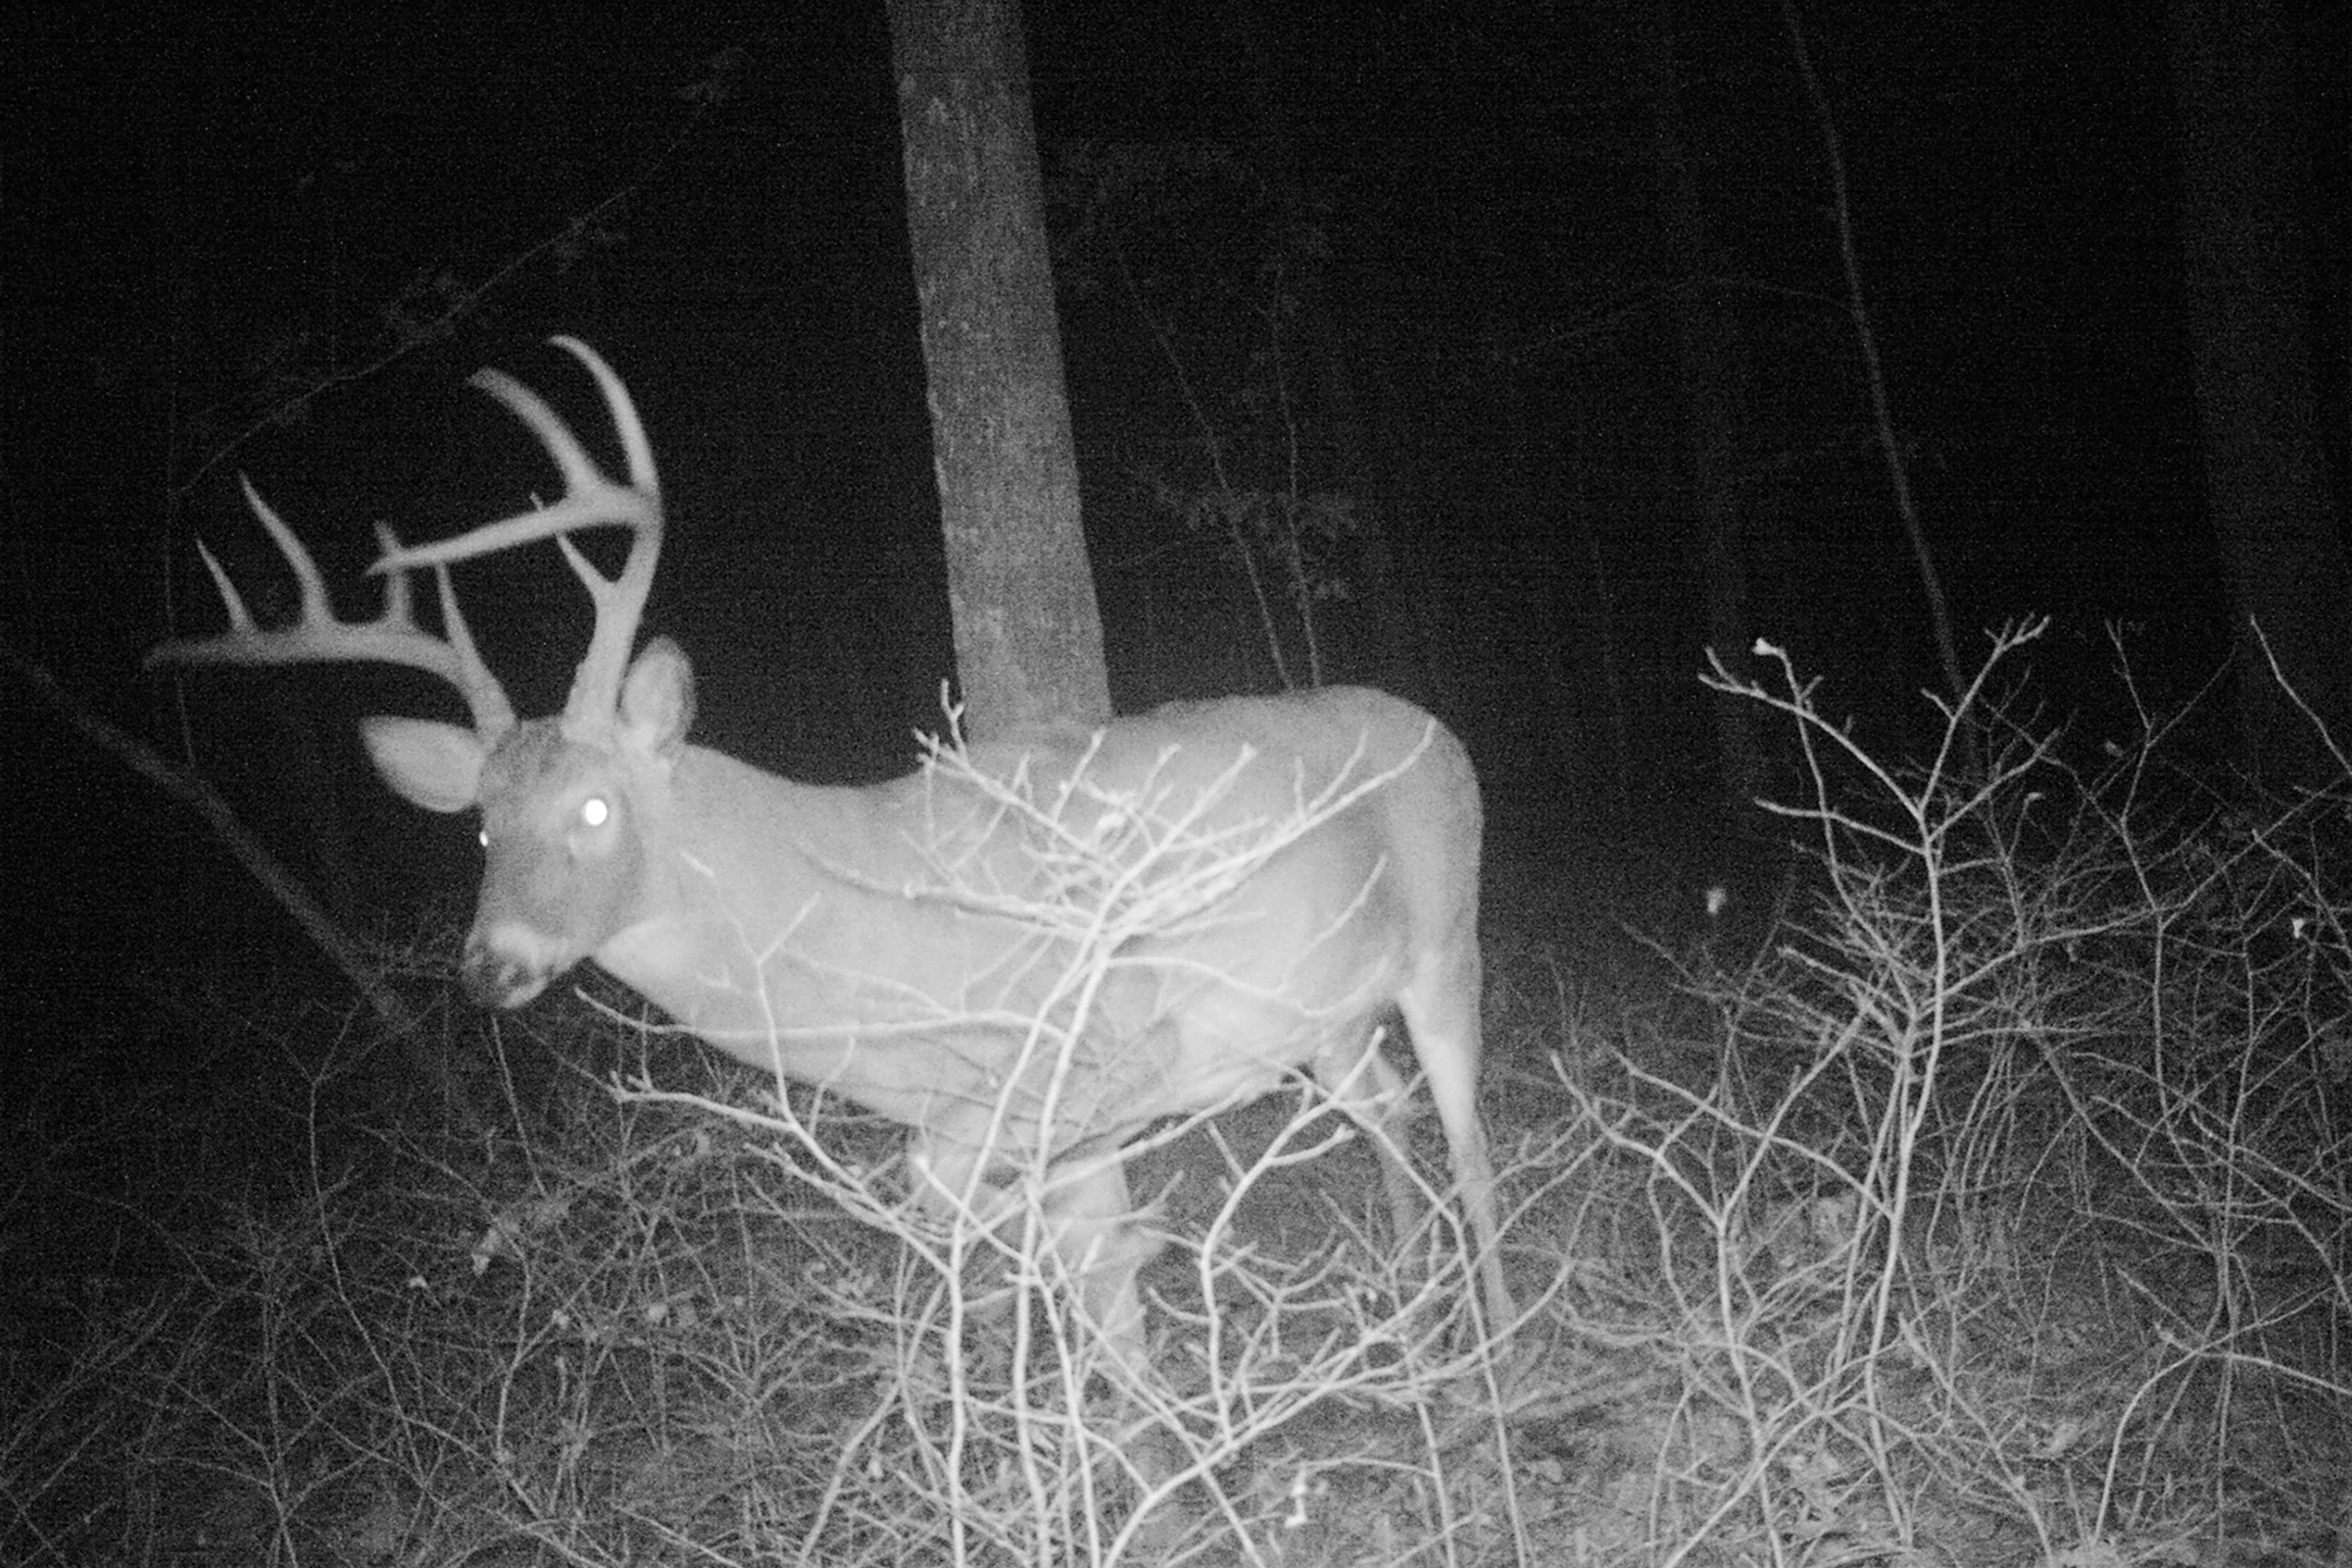
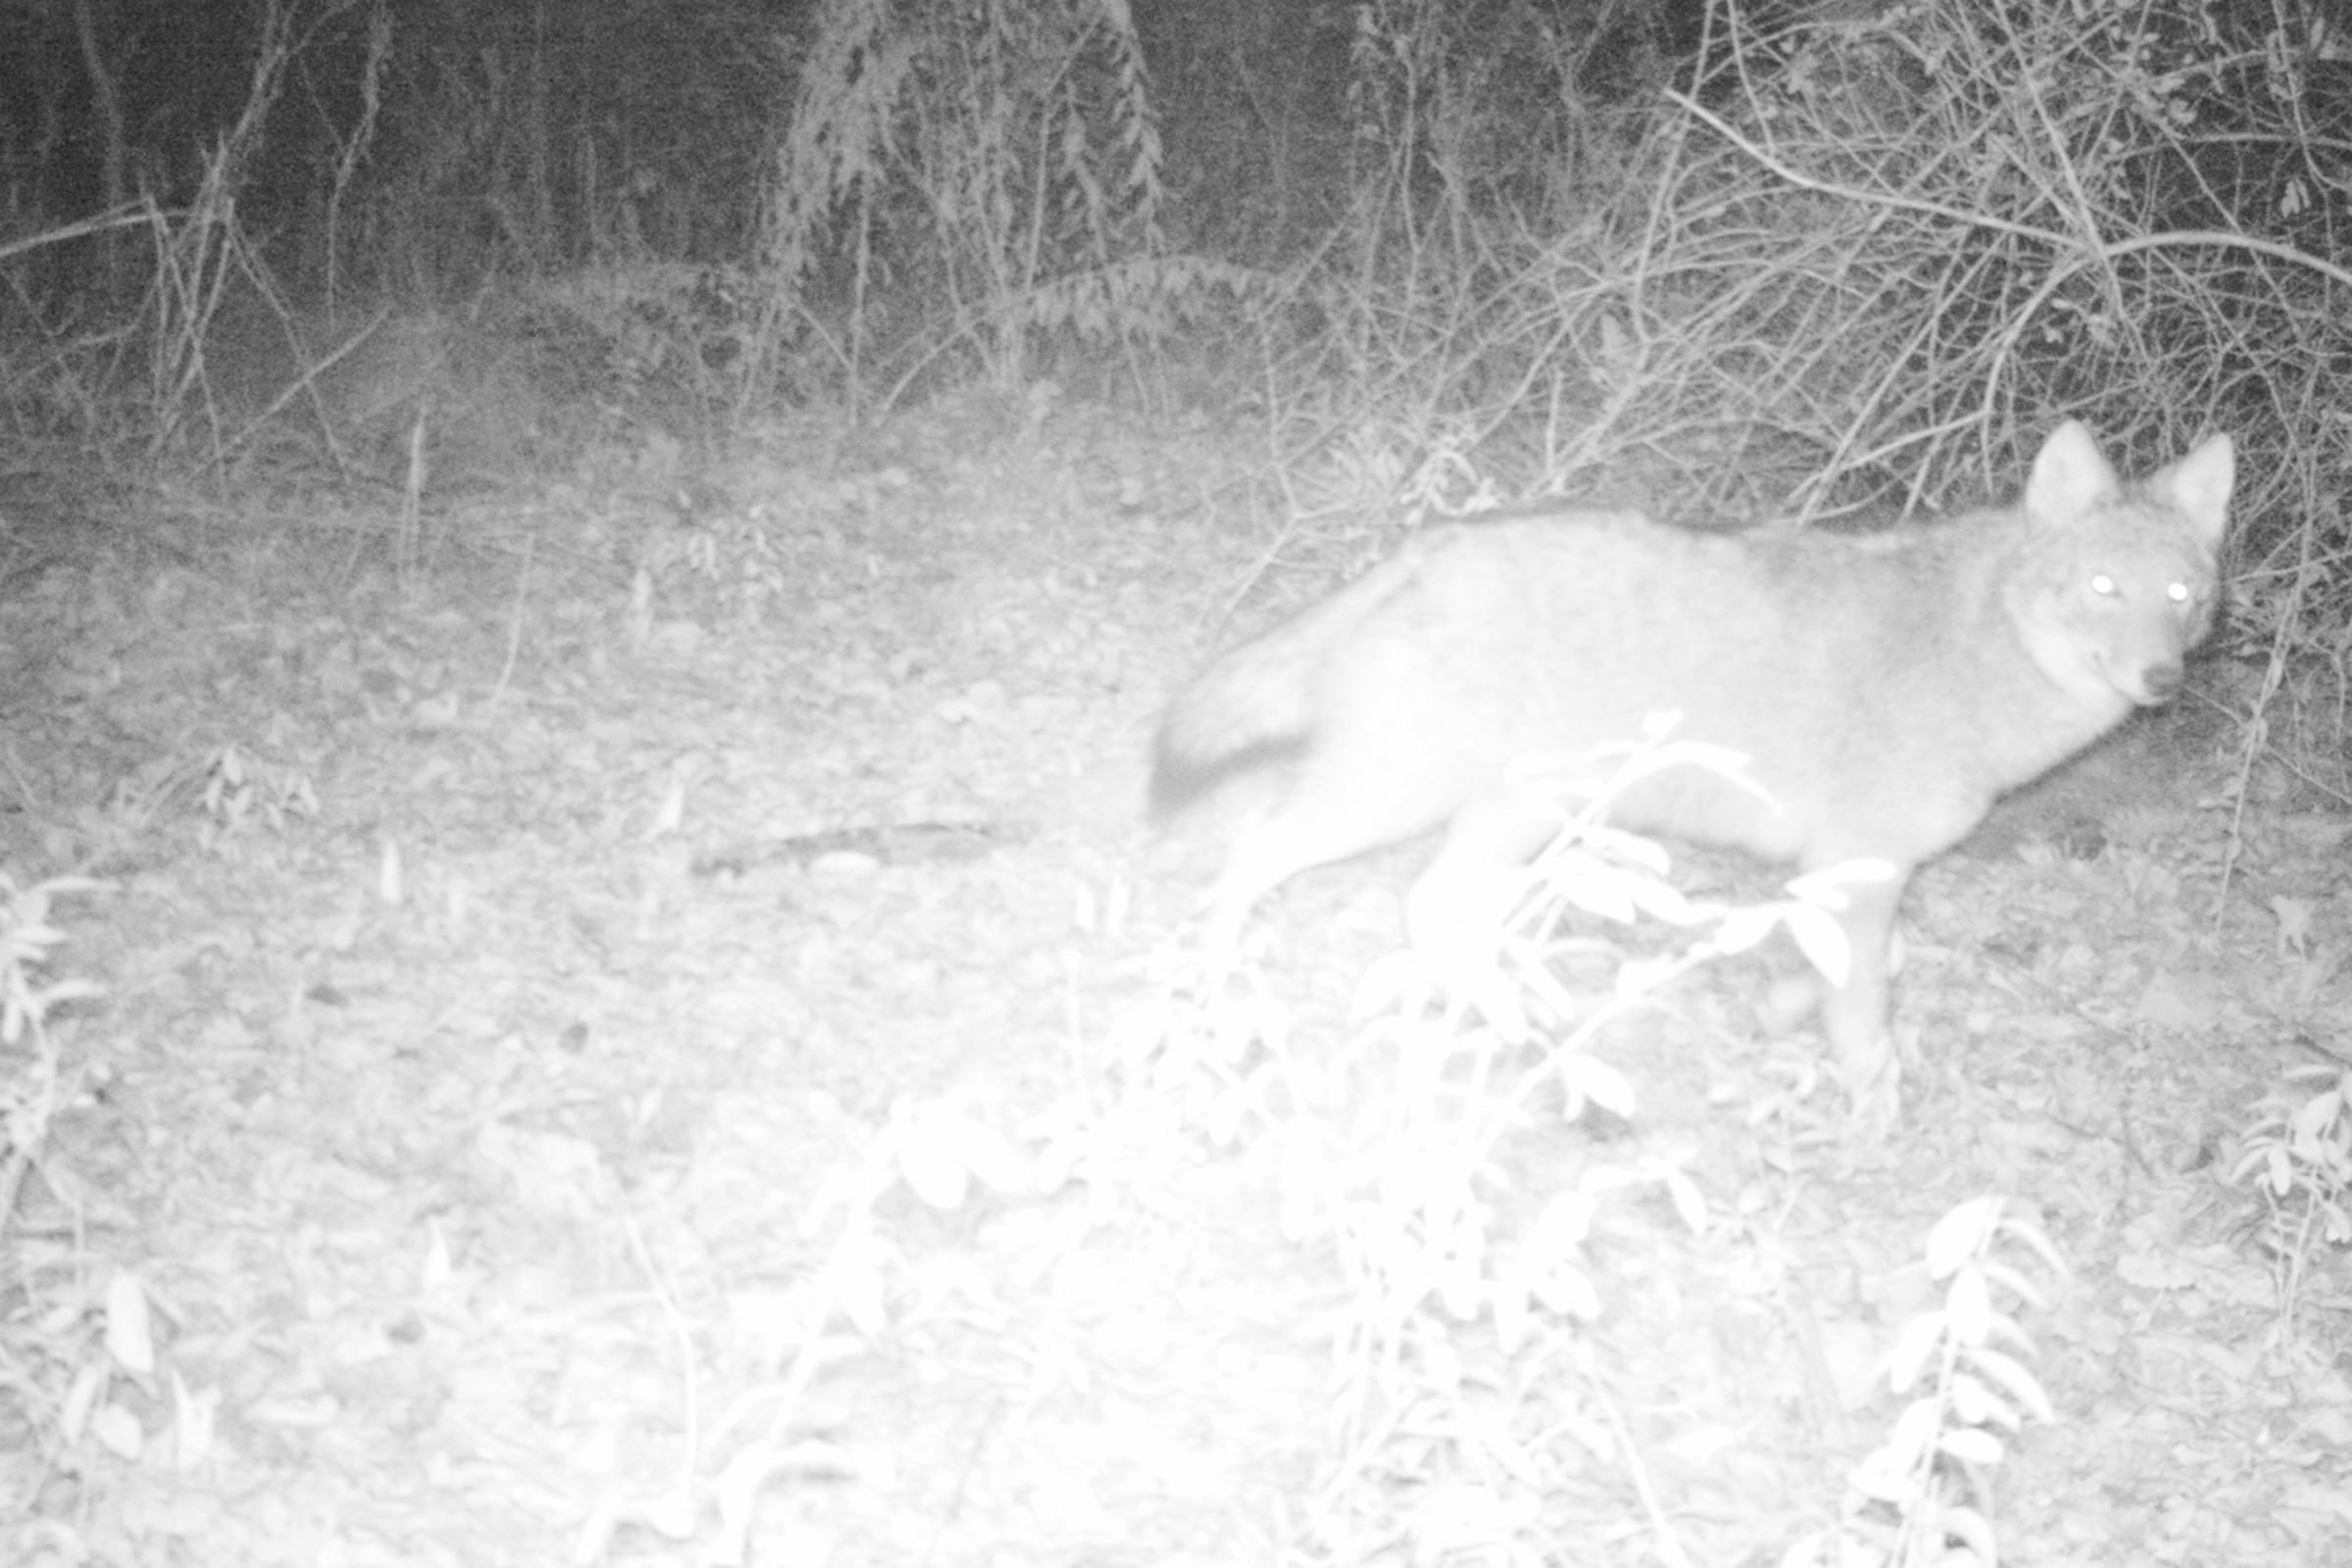
Rittenhouse is studying some of these other animals as well, including bobcats, cottontails, bats, and amphibians. This type of research is vital to better understand the existing and changing biodiversity within the state. Many wildlife researchers have begun to rely more on ‘camera trapping’ to gather data in a more cost-efficient way. Other research methods often require repeated capture and handling of animals, which are marked with ear-tags or tags similar to those put in dogs and cats and then released. Researchers continue trapping to determine how often a specific individual is recaptured. The resulting data are excellent, but the methods are labor-intensive, and that means expensive.
Camera trapping – placing cameras in wildlife habitat that can capture images remotely and then analyzing the photos taken – is a completely different way to study wild animals. But it raises many questions.
“How do you estimate abundance of unmarked species?” asks Rittenhouse. “How do you know you aren’t counting the same animal multiple times? What is the best spacing of cameras? What is the best time interval to take photos?” These are all examples of the questions researchers are working to answer, she says.
“The camera technology has finally gotten to the point where it produces research-quality data. Now cameras are durable, they have good battery life, and cost is at the point where they can be used more widely. Next, it’s a matter of finding which statistical methods work best.”
In a recent project, Kilburn, the research scientist, analyzed more than 300,000 images from wildlife camera traps:


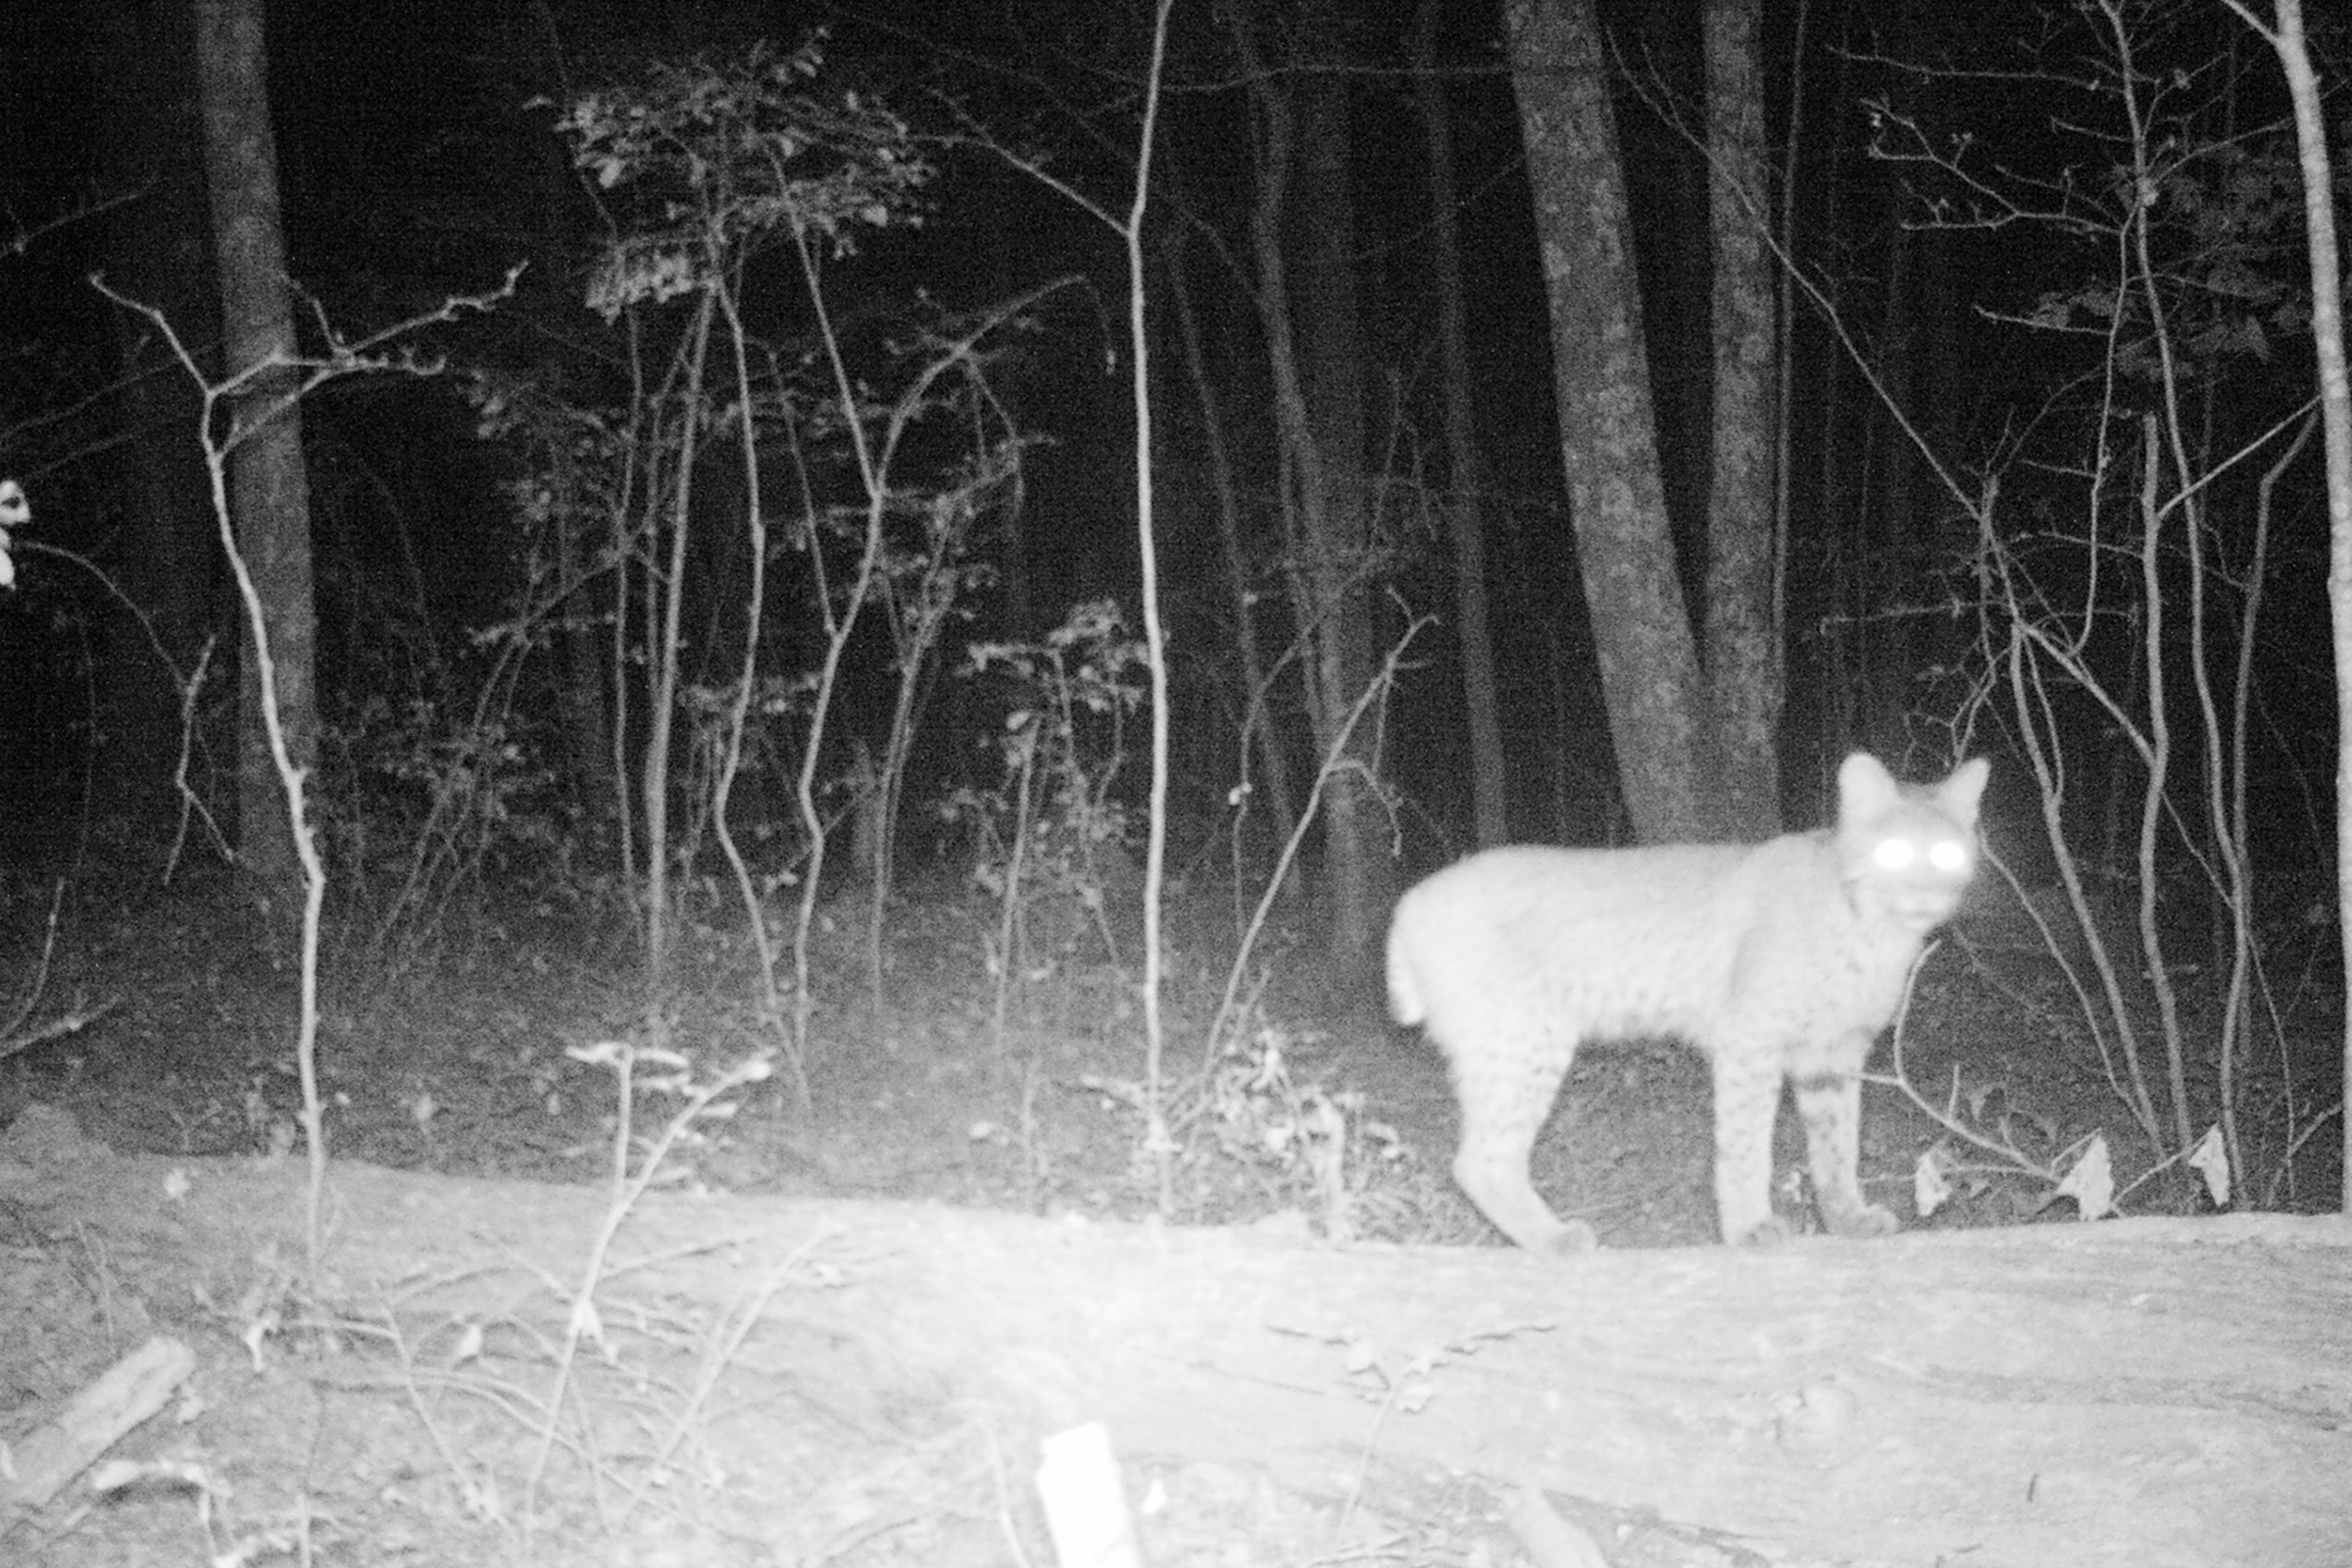
Rittenhouse’s current bobcat density project relies on cameras and she hopes to find the ideal placements to gather data on bobcats and other species. She is also calling on the data of citizen scientists through a platform called iNaturalist, where she and collaborators at the Connecticut Department of Energy and Environmental Protect (DEEP) started a project called the CT Bobcat project.
“It was difficult to design the project because there was not a lot of data about bobcats,” says Rittenhouse. “Hunters report what they see, so we knew the sightings were going up, and bobcats are reported statewide. We have been pleasantly surprised by the number of reports from citizens around the state on the iNaturalist page. The iNaturalist page has been very helpful for this project.”
An example of the importance of population management can be seen in the deer population over time. Deer were heavily hunted in the past and the population plummeted. In the 1930s, conservation efforts were put into place and the numbers recovered – almost too well. With overabundance comes change to management practices.
“There are places across the state where deer density is especially high, such as along the coast. In areas where you have a high number of deer per square mile, hunters may be allowed to harvest more deer to help manage the population,” says Kilburn. Data on abundance are essential for making these important decisions.
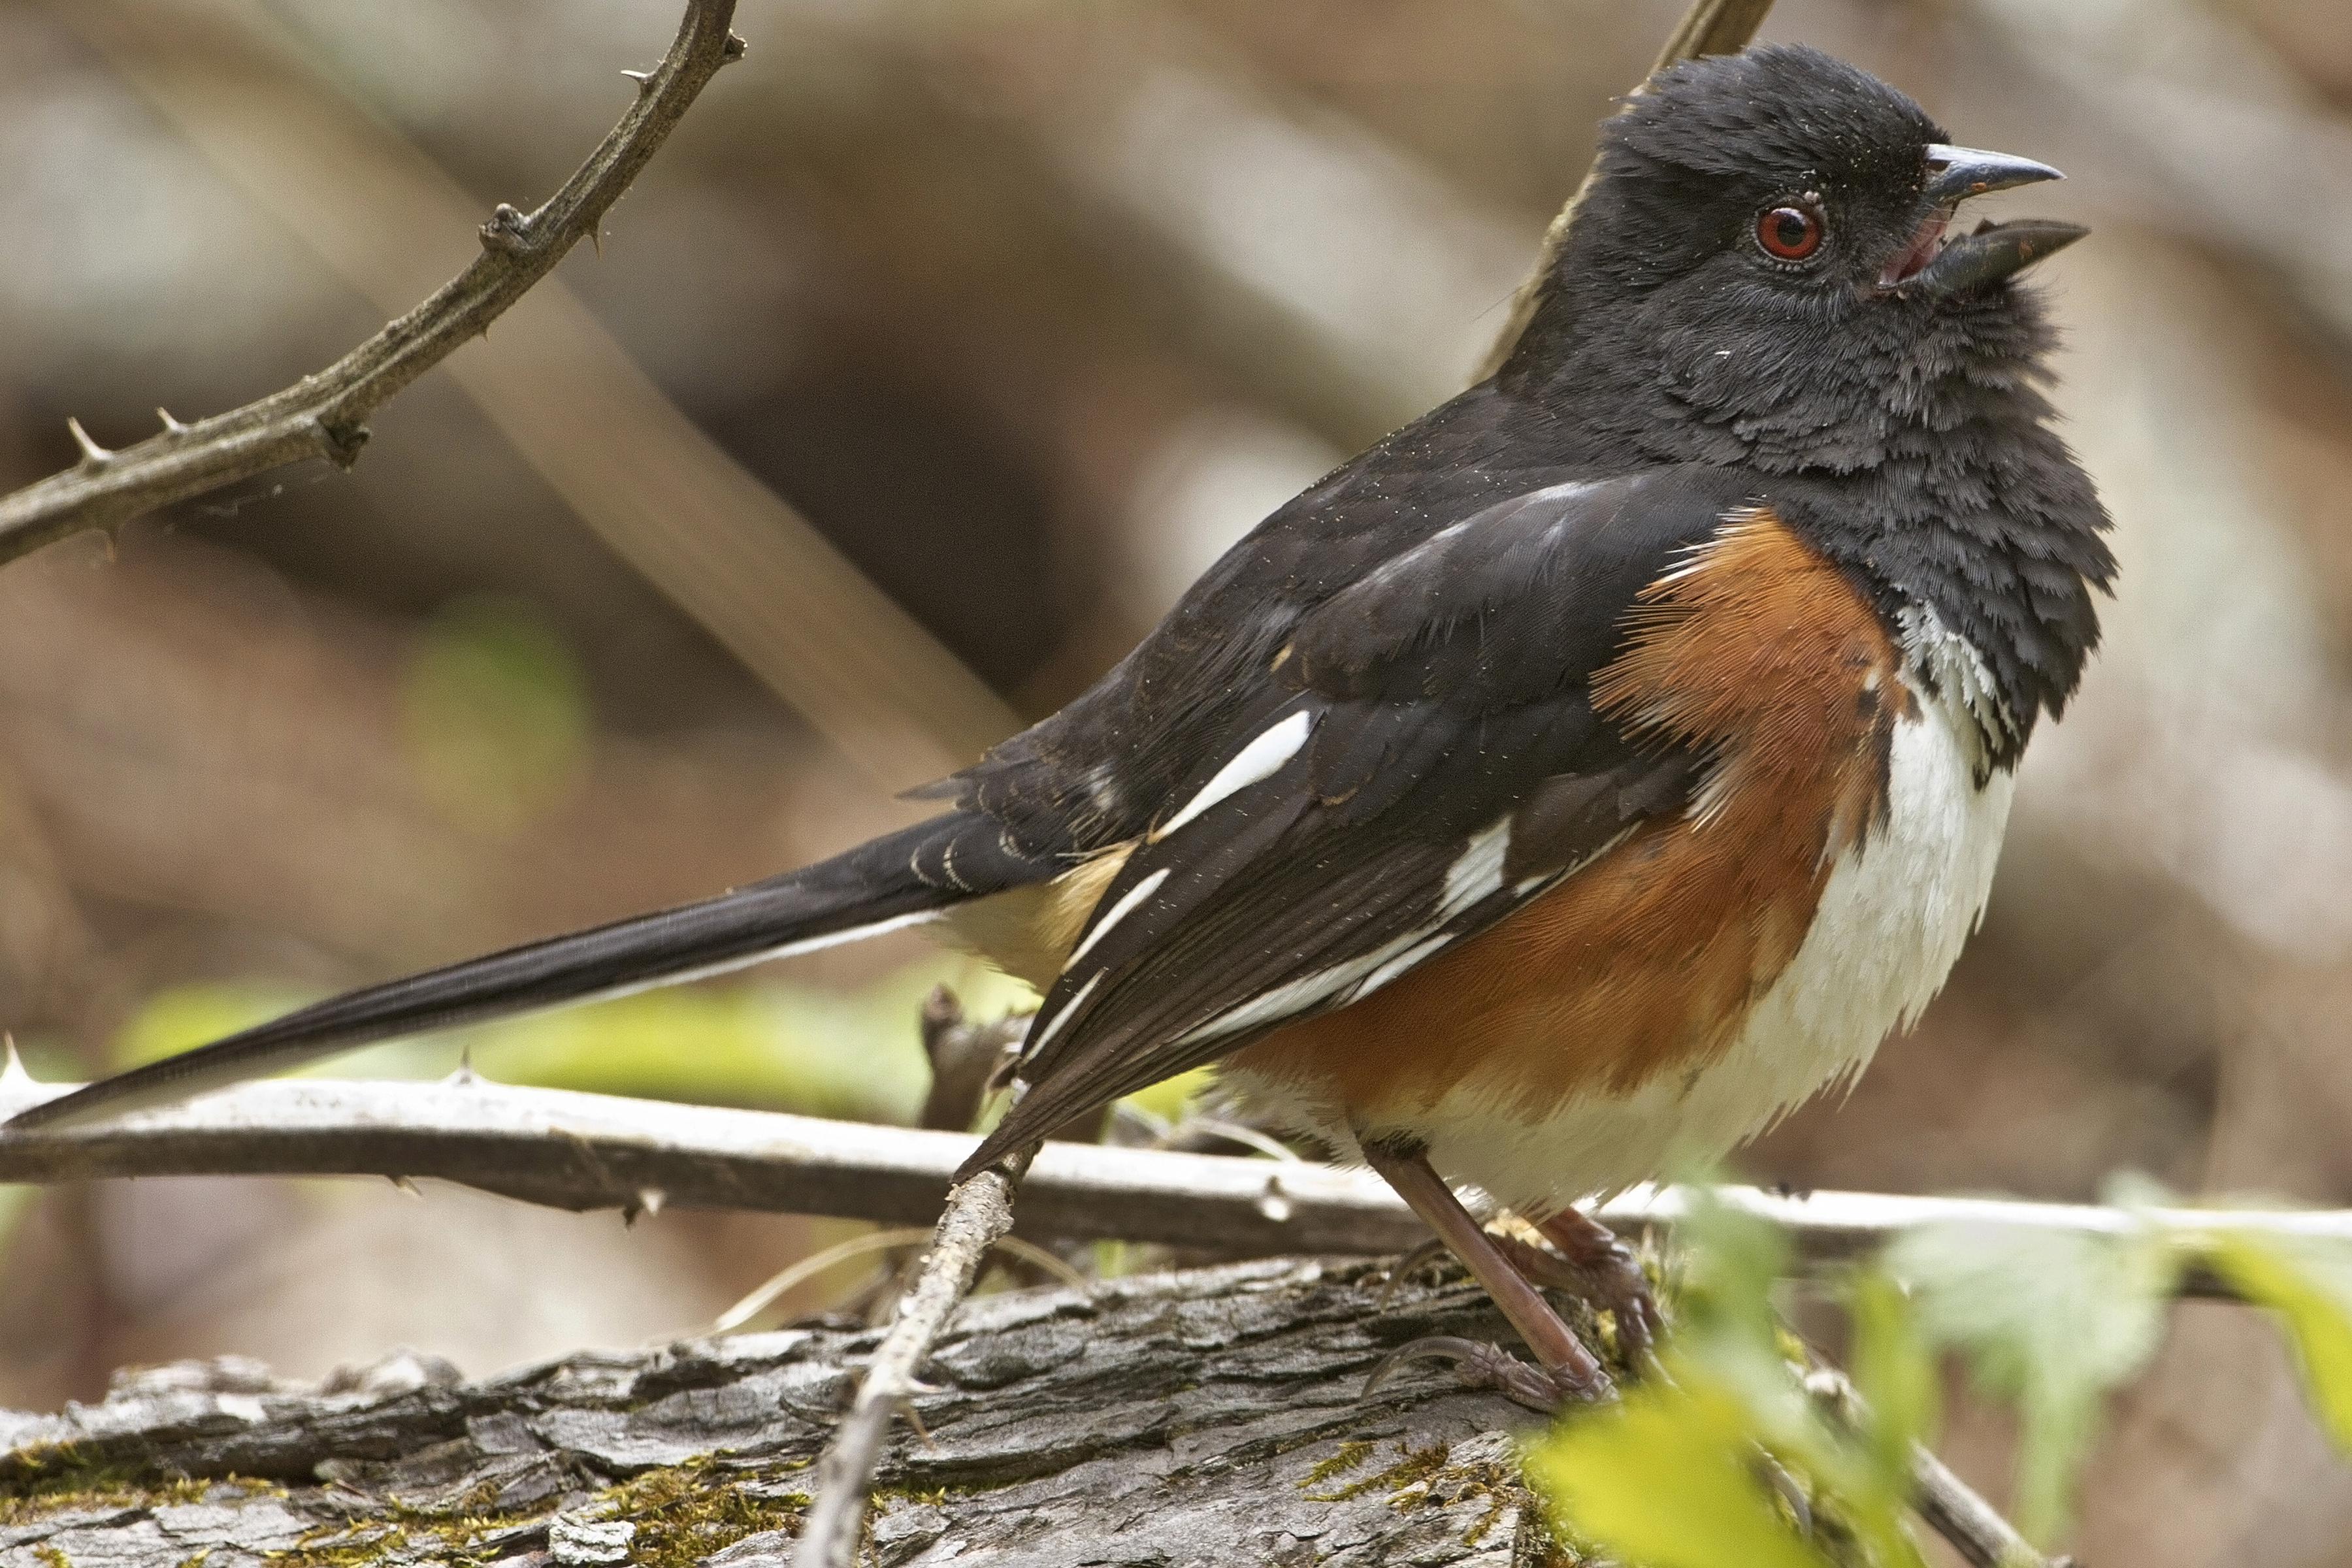
An atlas of birds
Another extensive citizen science project underway is the Connecticut Bird Atlas. This project is relying heavily on volunteer data, from hundreds of bird watchers, enthusiasts and amateurs alike, from across the state.
The project is being led by researchers Min Huang in the Department of Natural Resources and the Environment, and associate professor Chris Elphick and assistant professor Morgan Tingley, both in the Department of Ecology and Evolutionary Biology.
Elphick says there is a long history of bird atlases and systematic surveys of breeding species and which species are present. “The basic idea is to take a geographic area and make a grid, and collect data within each block on the grid.”
The current atlas project aims to repeat a breeding bird atlas made in the 1980s, and to collect much more data than the previous atlas had. Elphick says the new atlas will collect data over a whole year, distributions in breeding birds, non-breeding birds, and birds during migration. Data on relative abundance will also be collected.
“We are not simply going out to collect data on distributions,” says Elphick. “The first phase is to bring multiple data sets and merge those data with new citizen science.”
Oftentimes, predictive maps are made, but they stay in the ‘predictive’ stage, as they often go untested. In the bird atlas world, people collect extensive data but frequently go no further. Elphick says the current Connecticut Bird Atlas will be bringing those two worlds together to develop models with existing data, and using the help from citizen scientists to collect new data to test and improve those models. The models can then be applied to studying how populations have changed over time, how they may change in years ahead, and for making conservation decisions. The project will take another three years to complete.
“There are a lot of good reasons to collect these data,” says Elphick, “But most importantly, we want to provide data that is useful for the Department of Energy and Environmental Protection.”
As noted on the Connecticut Bird Atlas homepage, protecting the state’s birds requires that we know where they are.
Anyone can get involved, even if they aren’t trained naturalists, says Elphick, who is frequently asked by inexperienced birders if their data is good enough to be included. He says it is, and observing and reporting what is seen in one’s own backyard will help.
Logging observations on platforms such as iNaturalist only requires you to set up an account, then you can upload what you see and any photographs associated with the sightings.
The Connecticut Bird Atlas website has forms that can be completed online or by hand. Simply submit the forms to the address provided.
This post is part of a series about the effects of climate change on Connecticut. Other posts in the series include: Connecticut’s Forests Today a Far Cry from Towering Giants of Old; Working Toward Sustainable Solutions.
Listen to the writer, Elaina Hancock, discussing the climate change series with the UConn 360 podcast: