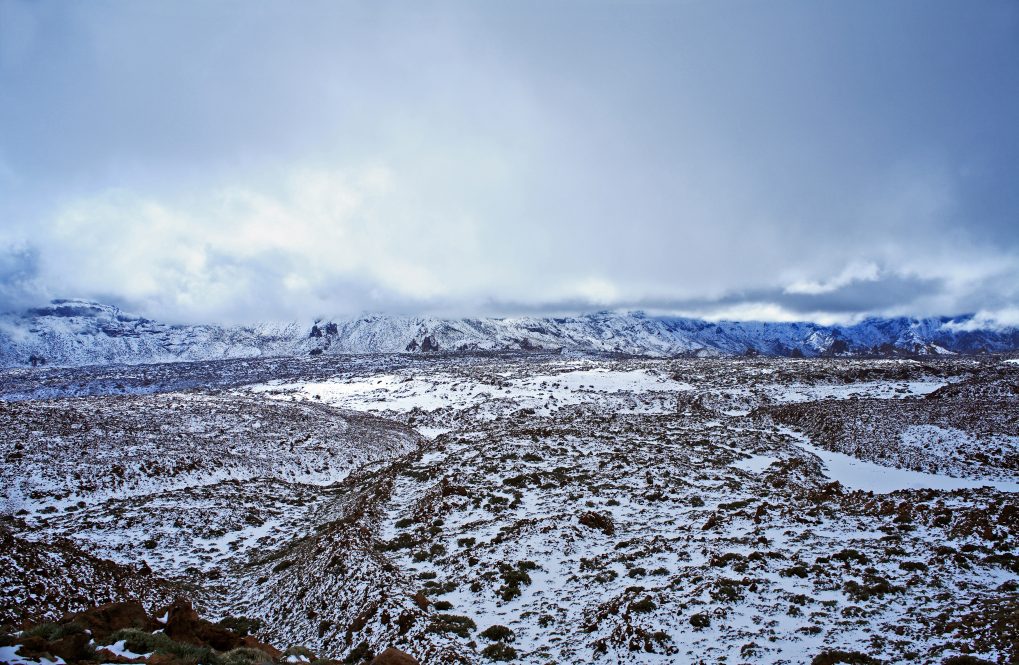
As the pace of warming in the Arctic continues to surpass the global average, a complex and expansive network of capillary-like features is emerging across the landscape. These new and rapidly evolving features have the potential to accelerate changes in Arctic ecosystems. For

instance, despite increased precipitation, lakes across the tundra are disappearing and the capillary system could be a factor not only in changes in hydrology but also in how much carbon is stored in the permafrost. While the impacts remain largely unknown, a team of scientists, including UConn Department of Natural Resources and the Environment Assistant Professor Chandi Witharana, Postdoctoral Research Associate Amal Perera, and graduate students Elias Manos and Michael Pimenta are using new technologies to create a pan-Arctic map to better understand the tundra capillary system and how this system will impact the region as the climate continues to change. The researchers describe their progress in a recent comment in Nature with lead author Anna Liljendahl, associate scientist at Woodwell Climate Research Center. Witharana met with UConn Today to discuss the project.
Can you talk about the tundra capillaries and how they form?
The capillaries are part of a unique landscape system. In the Arctic, we have the frozen layer – the permafrost — and above that we have an active layer where the frozen ground cracks and, in the summertime, water gets in and refreezes again. Over time, due to this repeated cracking, what forms is almost like mud and when everything refreezes, the cracks get bigger, creating ice wedges. The wedges push the soil up and together with other wedges form a network at the subsurface. Around the sides of the polygons there are depressions or troughs, and those troughs are connected in a network we call a capillary system.
How does the capillary system impact the landscape?
The troughs around the ice wedge polygons are very shallow, and could not be considered streams or creeks, but rather they are a kind of depression on the landscape and can act as a drainage network.
When the subsurface temperatures increase, the edges of the ice wedge polygons degrade, which means the top layers sink and the troughs get deeper over time through something we call vertical settlement and this means they can hold more water. In the summertime, these small ponds can absorb more heat and that can transfer into the permafrost and further degrade the system. You can have isolated lakes in the permafrost across the landscape that are not connected but over time, they can connect and then this capillary system can turn into something like a small creek or stream. A stream is a moving agent that can carry so many things. When the water is in motion, it changes the dynamics of nutrients, energy, and biogeochemical cycles across the landscape. This is how the capillary system is evolving rapidly.
Have you observed changes in the landscape since you started this research?
I have been seeing landscape changes in satellite images. My collaborators see the changes on the ground in their field sites, Speaking with them about their field observations, they have seen dramatic changes over two years.
For example, last year they went to the field site, and this year they saw troughs get connected through vertical settlement, so it’s happening not decade by decade, but much faster in certain places. Warming and its influence are happening disproportionately across the Arctic, it is not homogeneous. The scientists in the field see this rapid transformation.
Can you talk about the technology you used to perform this research?
When we started this research, scientists observed these kinds of degradations as very local processes, but with combined field observations across Siberia and Canada, we realized that it is not local. The problem is these are very remote locations across huge areas, 25 million square kilometers. We don’t know how this is happening, and these are micro-scale processes. If a trough is changing over time and they are on the meter or sub-meter scale, to study this we need high spatial resolution remote sensing observations to identify the micro-topography.
Remote sensing satellites like Sentinel or Landsat work on a 30-meter scale and that is too coarse to capture these dynamics but we were able to use commercial satellite data with sub-meter resolution of this region to pinpoint these degradations, like trough development, lake formations, and increasing connectivity.
Until this project, no one has tried mapping ice wedge polygons on a large scale. People tried mapping ice wedge polygons at a smaller scale, for example, a couple of thousand square kilometers, but the pan-Arctic tundra area is approximately 5 million square kilometers. If you put that into context, that is 384 Connecticuts.
Thankfully, the NSF Polar Programs granted us access to all the commercial satellite images. There are millions and millions of images and trillions of pixels, and we did a pilot project and developed a method to automate image extraction. We created datasets with the help of former and current graduate students who spent hours and hours digitizing small features, some 40,000 individualized polygons manually identified and digitized.
It’s painstaking, but we needed this data to train the model. We used AI and trained the algorithm to deploy this. The NSF also gave us the computation resources we needed to produce the first pan-Arctic ice wedge polygon map. We identified more than 1 billion individualized ice wedge polygons, and there are billions left to be mapped, but this is the first effort. We brought all the tools and heavy weapons into the picture to get this done.
What is the future of this research?
I think this project has opened eyes, including at the NSF Polar Program. This project triggered the chain reaction for studying other features, not only ice wedge polygons but also other disturbance features, including events similar to landslides. Since we have built the modeling pipeline, anyone can develop a model with their feature of interest.
Our next area of interest is mapping infrastructure at a pan-Arctic scale which will be detailed in a paper coming out soon. We plan to also look at economic assessment and political settlement. We are also mapping just the trough network since 1930 using historical aerial data to look at how the landscape has changed over the last 80 years.
With Google funding, we are trying to forecast the future. We feed satellite data into the forecasting model near real-time data where we know disturbances are happening, and we can focus on things like permafrost thaw and carbon release.
This research was made possible with funding from the National Science Foundation (award nos. 2234117, 2052107, 2051888, 1928237 and 1927723) and Google.org’s Impact Challenge on Climate Innovation.


